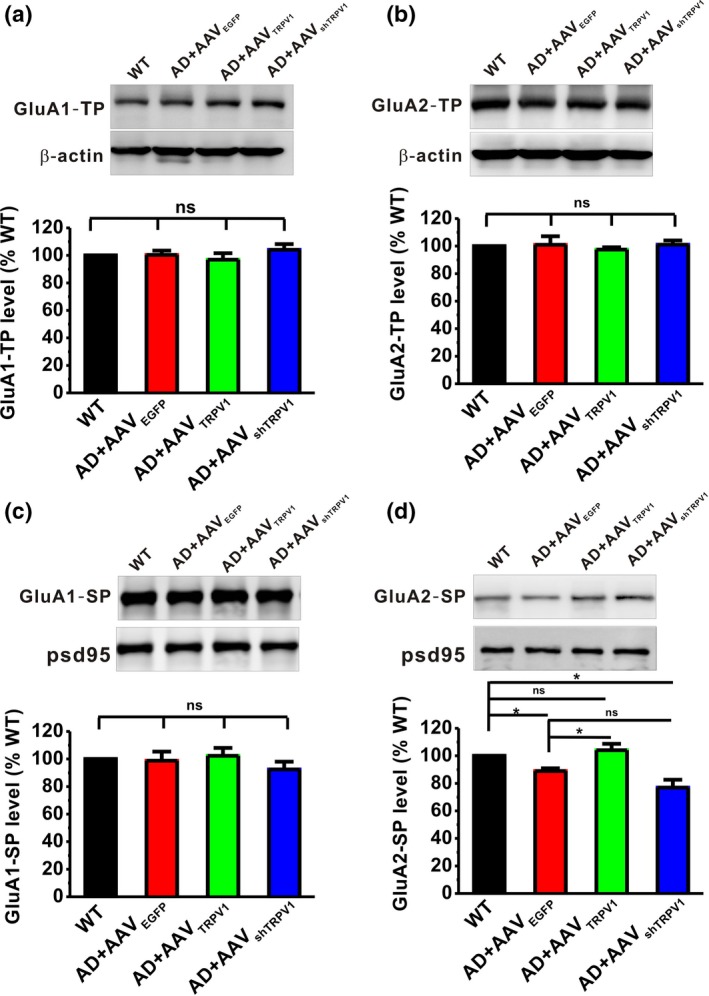
Figure 3.

TRPV1 increases the expression of GluA2 in the synapse. The relative protein levels of total GluA1 (a), total GluA2 (b), synaptic GluA1(c), and synaptic GluA2 (d) are normalized by WT mice (n = 4–6 in each group). One‐way ANOVA: F (3,21) = 0.707, p = .559 for total GluA1; F (3,13) = 0.351, p = .789 for total GluA2; F (3,21) = 0.636, p = .601 for synaptic GluA1; and F (3,13) = 10.829, p = .001 for synaptic GluA2. Data are expressed as mean ± SEM, *p < .05
