
Figure 2.
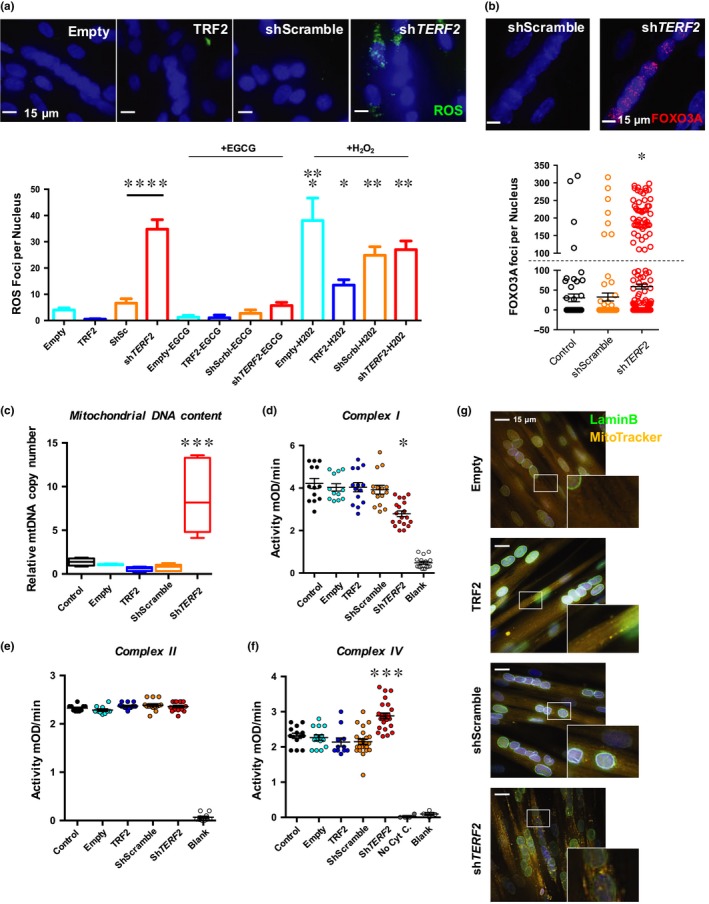
TRF2 knockdown is associated with increased ROS and modifies mitochondrial activity in postmitotic tissues. (a) Detection of ROS foci in transduced myotubes. We report the total number of ROS foci normalized to the number of nuclei. On average, the number of nuclei per cell and DAPI intensities was identical between conditions (Figure S3). N > 300 nuclei per condition, means ± SEM are shown. Hydrogen peroxide treatment increases ROS foci number (Empty vs. Empty + H2O2, p = .0274; Empty vs. TRF2 + H2O2, p = .0291; Holm–Sidak's multiple comparisons test; α = 0.05). Downregulation of TERF2 significantly increases ROS (shScramble vs. shTERF2, TRCN0000004812, p < .0001; Holm–Sidak's multiple comparisons test; α = 0.05). (b) FOXO3A staining and quantification of foci per nucleus; single nucleus cells were excluded from the analysis. Positive cells correspond to cells exhibiting >100 FOXO3A foci per nucleus (cutoff symbolized by dashed line). N = 300 nuclei per condition, means ± SEM are shown. TERF2 knockdown is associated with an increase of positive FOXO3A cells (n = 7 vs. n = 80 positive nuclei, shScramble vs. shTERF2, respectively, p < .0001; chi‐square test; α = 0.05). (c) Relative quantification of mitochondrial DNA content in transduced myotubes. ShTERF2‐transduced myotubes show an increase in mitochondrial DNA content (shScramble vs. shTERF2, p = .0003; Kruskal–Wallis multiple comparisons test; α = 0.05). N = 6 per condition (biological triplicate in technical duplicate), means ± SEM are shown. (d–f) Mitochondrial complex I (d), II (e), and IV (f) activity in transduced myotubes. ShTERF2‐transduced myotubes exhibit specific mitochondrial defects. We report a decreased complex I activity (p < .001) and an increased complex IV activity (p < .001, Kruskal–Wallis multiple comparison test; α = 0.05). (g) Mitochondrial network in transduced myotubes was analyzed using MitoTracker®. An average of 100 z‐stacks was taken for each condition (DeltaVision Elite®, GE). Pictures from 10 to 15 independent and randomly chosen microscope fields were taken, treated postacquisition, and deconvoluted with IMARIS. Single nucleus cells were excluded from the analysis. Nuclei were stained using an anti‐lamin B antibody (green) and counterstained with DAPI. A punctate mitochondrial staining is observed in myotubes transduced with shTERF2 suggesting mitochondrial fission. Similarly, H2O2 treatments induce a punctuated mitochondrial staining (Figure S3). *p < .05; **p < .01; ***p < .005, ****p < .001