Figure 3.

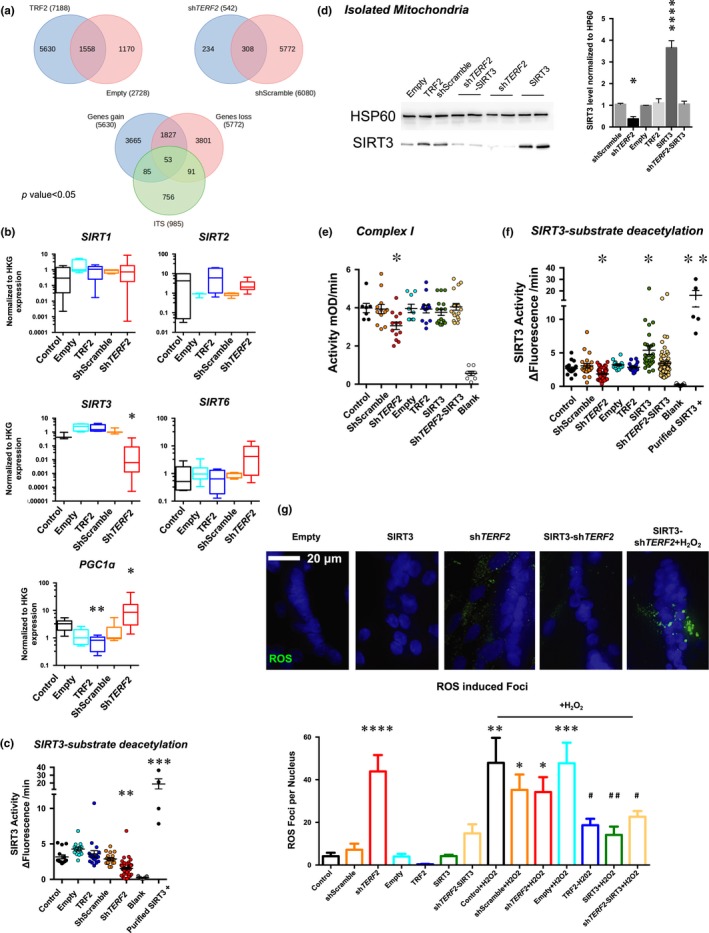
TRF2 binds and modifies expression of the subtelomeric SIRT3 gene. (a) Venn diagrams generated from a TRF2 ChIP‐Seq performed in myotubes, and all data are uploaded into the GEO database under the accession number http://www.ncbi.nlm.nih.gov/geo/query/acc.cgi?acc=GSE88983. Significant peaks (p < .05) were identified and annotated. A differential analysis identified the significant peak that was “lost” or “gained” by TRF2 modulations. A final Venn diagram was then produced using the genes associated with the peaks found only in the shScramble condition (e.g., lost gene); the genes related to the peaks found only in the TRF2 condition (e.g., gained gene) and genes related to ITS by an in silico analysis (see Section 4 for details). The list of 53 genes localized within 100 kb of modulated ChIP peaks and ITS can be found in Table S1. This analysis led to identification of SIRT3 as a candidate gene. (b) Gene expression quantified by RT‐qPCR in transduced myotubes normalized to three housekeeping genes (HKG: HPRT, PPIA, and GAPDH; ΔΔCt method). N = 6 per condition (technical duplicates of biological triplicates), means ± SEM with associated statistical significance are reported (Kruskal–Wallis multiple comparisons test; α = 0.05). TERF2 depletion reduces transcription of SIRT3 without modulating other main Sirtuins, correlates with PGC1α upregulation, and is associated with reduced SIRT3 activity as reported in (c) SIRT3 activity in enriched mitochondria extracts from transduced myotubes. A purified SIRT3 recombinant protein was used as positive control (Kruskal–Wallis multiple comparisons test; α = 0.05). (d–g) SIRT3 rescue experiments and immunoblots of enriched mitochondria extracts from transduced human myotubes using HSP60 as a loading control (d). TERF2‐modulated expression results in decreased SIRT3 level (shScramble vs. shTERF2, p = .0425). (e–f) Mitochondrial complex I (e) and SIRT3 activity (f) in mitochondrial extract from transduced myotubes. SIRT3 overexpression in TRF2‐depleted myotubes restores the mitochondrial‐associated activity (shScramble vs. shTERF2‐SIRT3, p > .9; in both assays, Holm–Sidak's multiple comparisons test; α = 0.05, Figure S5). (g) ROS foci in transduced myotubes. We report the total number of ROS foci normalized to the number of nuclei (Figure S6). N > 400 nuclei per condition, means ± SEM are shown. SIRT3 overexpression decreases ROS foci number upon TERF2 downregulation (shScramble vs. shTERF2‐SIRT3, p = .496; shScramble vs. shTERF2, <.0001; Holm–Sidak's multiple comparisons test; α = 0.05) and protects myotubes under H2O2 treatment (Empty + H2O2 vs. SIRT3 + H2O2, p = .0034; ShScramble + H2O2 vs. SIRT3‐shTERF2, p = .039; Holm–Sidak's multiple comparisons test; α = 0.05). *p < .05; **p < .01; ***p < .001; *****p < .0001; # p < .05; ## p < .01 (H2O2 conditions)
