Figure 6.

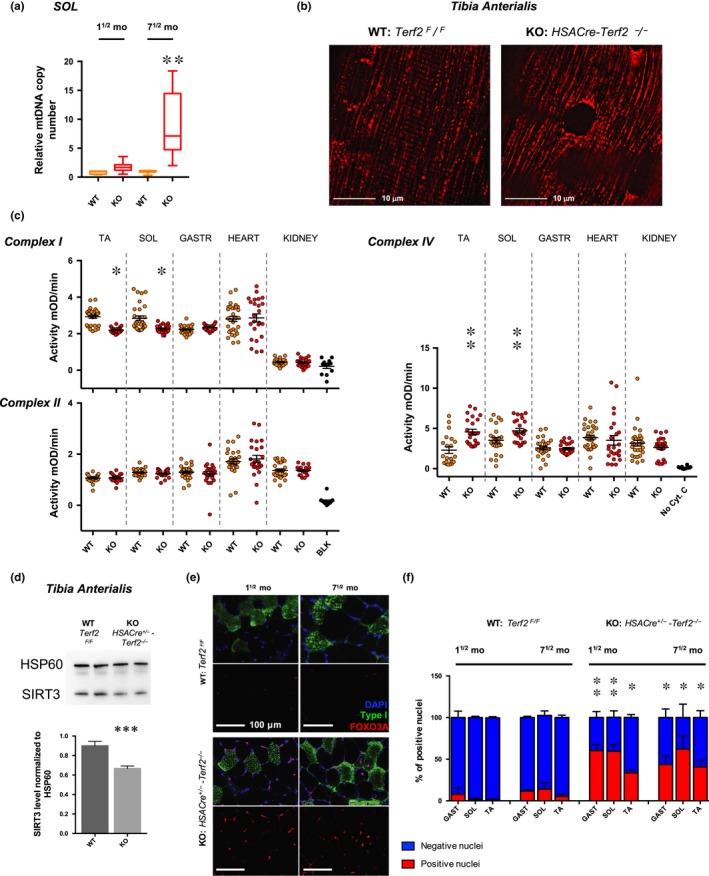
Muscle‐specific Terf2‐deficient mice exhibit increased mitochondrial DNA content, mitochondrial dysfunction, and nuclear Foxo3a accumulation. (a) Relative quantification of mitochondrial DNA content in the soleus of transgenic mice (WT and KO). Terf2 KO mice exhibit a significantly higher mtDNA content (Kruskal–Wallis multiple comparisons test; α = 0.05). n = 12 per group, means ± SEM are shown. (b) Electroporated tibia anterialis (TA), using Mito‐DsRed in control and transgenic mice (n = 4 per group). Electroporation of the construct allows one to stain the mitochondrial network in tissues. The mitochondrial network of KO mice (right) appears punctuated and less structured as in controls (left). (c) Mitochondrial complex I, II, and IV activity in tissues (e.g., kidney; heart; soleus; tibia anterialis) from 40‐week‐old transgenic WT and KO mouse (n = 10 per data point). Terf2 KO mice exhibit skeletal muscle‐specific mitochondrial defects. We report a decreased complex I activity (p < .05, paired, two‐tailed Student's t test; α = 0.05) and an increased complex IV activity (p < .001, paired, two‐tailed Student's t test; α = 0.05), potentially part of a compensating phenomenon. No statistical differences were observed between WT and KO kidney and heart extracts. (d) SIRT3 immunoblots of enriched mitochondria extracts from the tibia anterialis (TA) of transgenic mice using HSP60 as loading control. N = 5 per group. Terf2 abolished expression results in decreased SIRT3 level (WT vs. KO, p = .0007). (e–f) Foxo3a immunofluorescence and associated quantifications in muscles along with type I staining (e.g., GAST, SOL, and TA). No statistical association was found among positive nuclei and fiber types. Terf2 KO mice exhibit a higher percentage of Foxo3a‐positive nuclei (aged and muscle‐matched KO vs. WT, p < .05; Kruskal–Wallis multiple comparisons test; α = 0.05). * <.05; ** <.01; *** <.001
