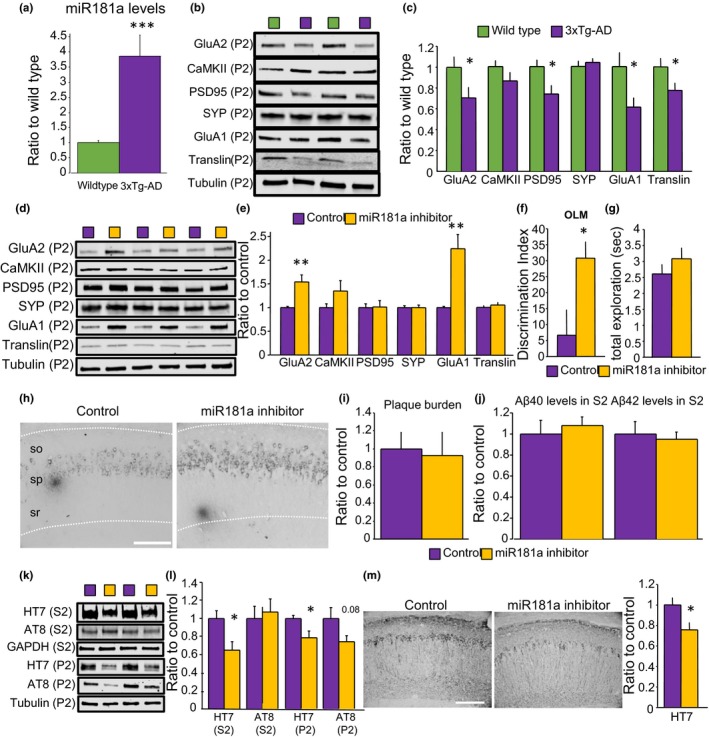
Figure 4.

miR‐181a inhibition in the hippocampus of 3xTg‐AD animals increased synaptic GluA1 and GluA2 protein levels, rescued object location memory impairments, and diminished tau protein levels. (a) Mature miR‐181a levels quantified by Taqman qPCR in hippocampal P2 fractions of 13‐month‐old wild‐type and 3xTg‐AD mice. microRNA levels were normalized to 18S ribosomal RNA [t(37) = 4.06 p = .0002, n = 20 and 19]. (b) Representative immunoblots of the data quantified in C. (c) Protein levels in the P2 fractions of the hippocampus of 13‐month‐old wild‐type and 3xTg‐AD mice. GluA2 [t(25) = 2.11 p = .04], CaMKII [t(27) = 1.43 p = .16], PSD95 [t(28) = 2.53 p = .01], synaptophysin (SYP) [t(28) = 0.53 p = .59], GluA1 [t(27) = 2.36 p = .02], and translin [t(27) = 2.13 p = .04]. Blots were normalized to tubulin protein levels. n = 13–16 per group. * = p < .05 versus wild‐type. (d) Representative immunoblots of the data quantified in E. (e) Protein levels in the P2 fractions of the hippocampus of 13‐month‐old injected 3xTg‐AD mice. GluA2 [t(21) = 3.61 p = .001], CaMKII [t(21) = 1.37 p = .18], PSD95 [t(21) = 0.14 p = .88], synaptophysin (SYP) [t(20) = 0.14 p = .88], GluA1 [t(21) = 4.13 p = .0005], and translin [t(18) = 0.77 p = .45]. Blots were normalized to tubulin protein levels. n = 9–12 per group. ** = p < .01 versus control. (f) Object location memory (OLM) discrimination index in 13‐month‐old 3xTg‐AD mice injected with AAV control or AAV miR‐181a inhibitor [t(38) = 2.60 p = .013, n = 19 and 21]. * = p < .05 versus control. (g) Total exploration time in seconds (sec) on the test [t(38) = 1.06 p = .29]. (h) Representative image of the staining with 6E10 for a control (left) and a mouse injected with miR‐181a inhibitor (right). so = stratum oriens, sp = stratum pyramidale, sr = stratum radiatum. Scale bar = 100µm. (i) Analysis of Aβ plaques [t(8) = 0.21 p = .83, n = 4 and 6]. (j) Measurements by electrochemiluminescence sandwich immunoassay of Aβ40 [t(33) = 0.50 p = .61] and Aβ42 [t(33) = 0.37 p = .70] in the S2 fraction of the hippocampus of injected mice. n = 17 and 18. (k) Representative immunoblots of the data quantified in L. (l) Protein levels of total tau (measured by the HT7 antibody, normalized to GAPDH) [t(30) = 2.69 p = .011, n = 15 and 17], and phosphorylated paired helical filament tau at residues Ser202/Thr205 (measured by the AT8 antibody, normalized to HT7) [t(28) = 0.37 p = .71, n = 15] in the S2 and P2 fractions of the hippocampus of injected mice. * = p < .05. (m) Analysis of HT7 staining [t(8) = 2.42 p = .04, n = 4 and 6] and representative images. Scale bar = 100µm. P2 = crude synaptosome fraction, S2 = soluble fraction
