
Figure 3.
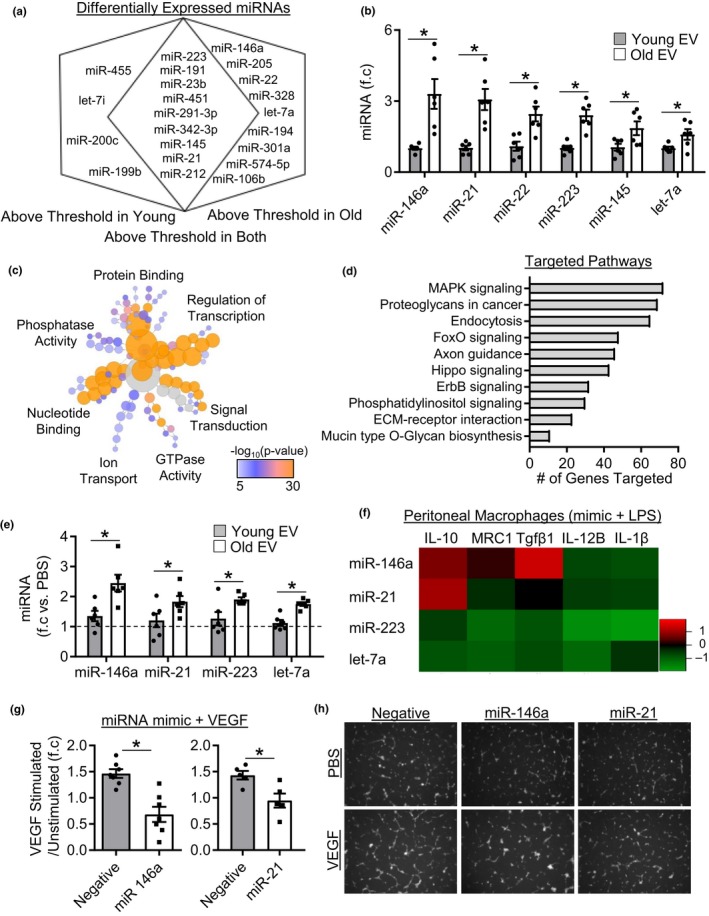
Aging alters plasma EV‐like particle Cargo. (a) Venn diagram showing differentially expressed miRNAs between young and old EVs, n = 4 samples per group. (b) Real‐Time PCR validation of differentially expressed miRNAs in an independent sample set, n = 6/group, *p < .05. (c) Bioinformatics analysis of the molecular function of miRNAs upregulated in old EVs and (d) predicted KEGG pathways targeted. (e) MiRNA expression in macrophage treated with either young or old plasma EVs. Expression is relative to PBS‐treated cells (dashed line). n = 6/group, *p < .05 old EV versus young EV. (f) Log2 gene expression in macrophages transfected with miRNA mimics then stimulated with LPS for 4 hr, n = 5/group. (g) Quantification of tube formation in stimulated/unstimulated cells in control, miR‐146a, and miR‐21 transfected cells, n = 5‐7/group. (h) Representative tube formation images. All values are mean ± SEM