
Figure 4.
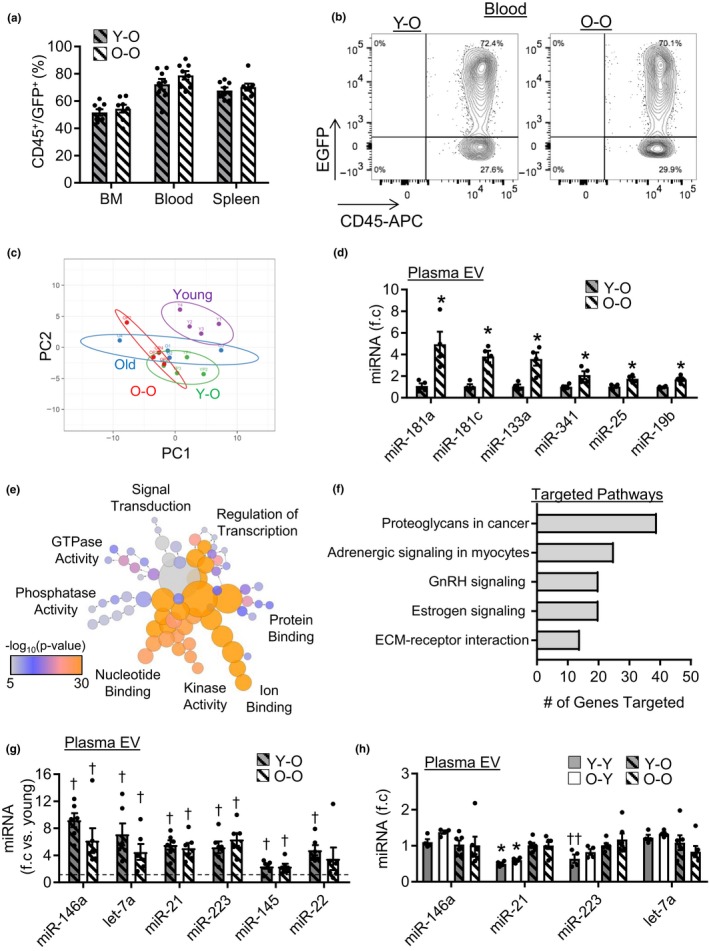
Effect of bone marrow (BM) and circulating cell age on EV miRNA expression. (a) Quantification young and old reconstitution in aged mice, n = 8/group. (b) Representative flow cytometry images of donor CD45/GFP+ cells in the blood. (c) Principle component analysis of miRNA expression in plasma EVs from young, old, YO and OO mice. (d) Differentially expressed miRNAs in plasma EVs from YO and OO mice identified by miRNA qPCR array, n = 4/group, *p < .05. (e) Bioinformatics analysis of the molecular function of miRNAs differentially expressed between YO and OO mice and (f) predicted KEGG pathways targeted. (g) Expression of age‐associated miRNAs in YO and OO plasma EVs. Groups are relative to young plasma EV miRNA expression (dashed line), n = 6/group, † p < .05 versus young plasma EVs. (h) Plasma EV miRNA expression in YY, OY, YO, and OO mice, n = 4–6/group, *p < .05 versus YO and OO, and †† p < .05 versus OO. All values are mean ± SEM