
. 2019 Aug;17(8):681–696. doi: 10.2174/1570159X16666180620155941
© 2019 Bentham Science Publishers
This is an open access article licensed under the terms of the Creative Commons Attribution-Non-Commercial 4.0 International Public License (CC BY-NC 4.0) (https://creativecommons.org/licenses/by-nc/4.0/legalcode), which permits unrestricted, non-commercial use, distribution and reproduction in any medium, provided the work is properly cited.
Fig. (1).
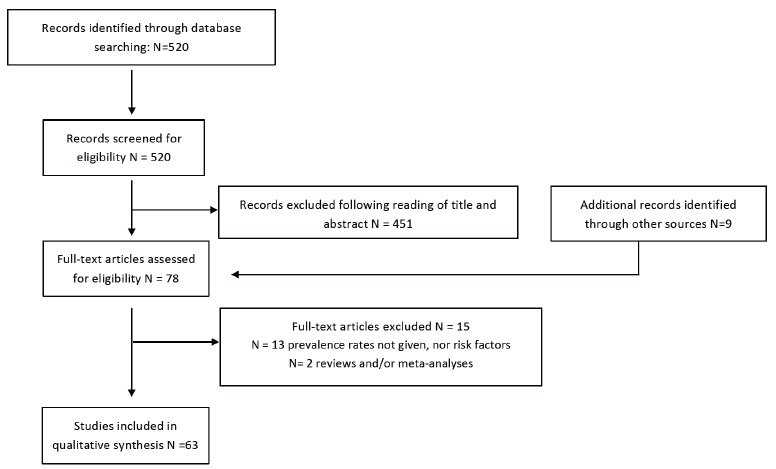
Flow chart showing the selection of studies.