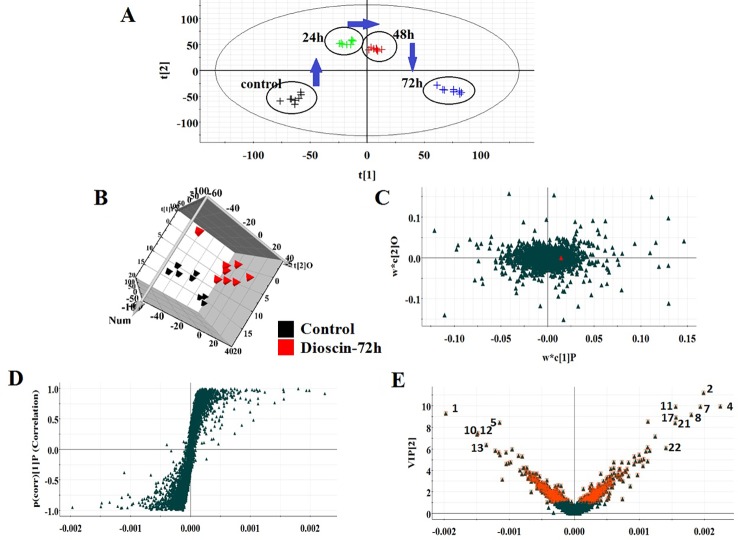
Figure 1.
PCA scores’ plot of cell metabolism trajectory in the dioscin-treated group at different time points in positive mode (A). 3D OPLS-DA score plot of cell UPLC-MS spectra data between control and 72 h dioscin-treated group in positive mode (B). Loading-plot of OPLS-DA model of UPLC-MS spectra data between control and 72 h dioscin-treated group in positive mode (C). S-plot of OPLS-DA model of UPLC-MS spectra data between control and 72 h dioscin-treated group in positive mode (D). VIP-plot of OPLS-DA model of UPLC-MS spectra data between control and 72 h dioscin-treated group in positive mode (E).

