
Figure 3.
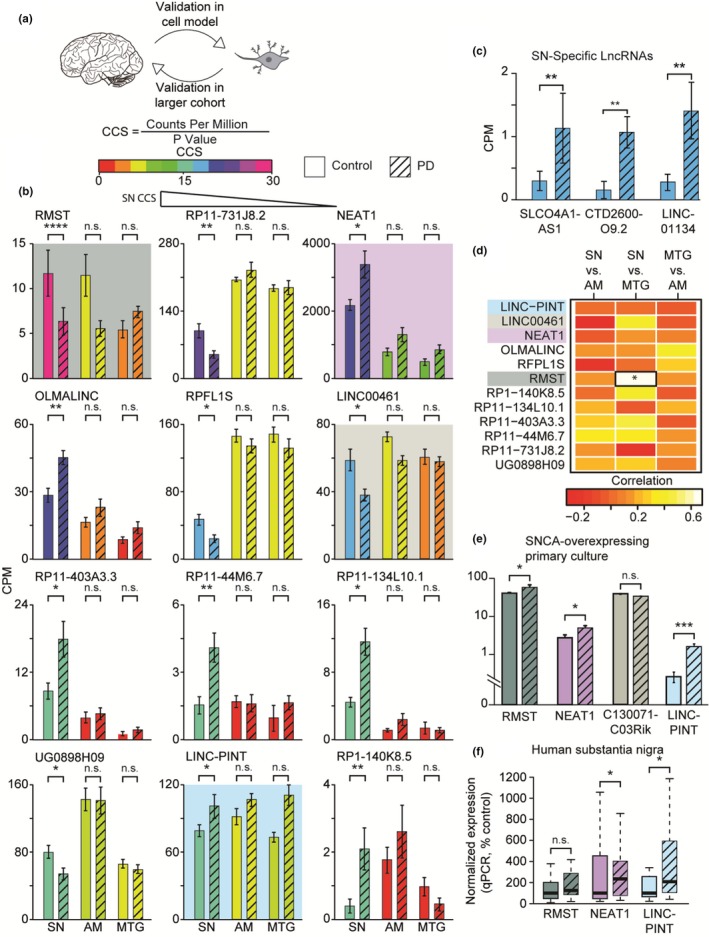
CCS‐based screen of brain‐expressed lncRNAs identifies prominent elevation of LINC‐PINT in PD SN and a primary culture model. (a) Identified lncRNAs were investigated in an additional model, and remaining candidates were subjected to investigation using qPCR on a larger cohort of SN samples. (b‐c) Bar plots of CPM values for 15 top‐scoring lncRNAs in the SN, AM, and MTG. Bars are colored according to tissue‐specific CCS. Each graph reflects a different lncRNA, shown according to decreasing score. Colored panels describe genes with murine homologs, later analyzed in panel (e); panel (c) describes lncRNAs only expressed in the SN (solid bars: controls, striped bars: PD; FDR‐corrected p‐values for edgeR RNA‐Seq analysis). (d) Heat map describing the correlation between the expression levels of top‐scoring lncRNAs in the three examined tissues, in a subset of 13 donors for whom all three tissues were available. Cells surrounded by a black box represent a statistically significant correlation. (e) Bar plots of SN‐top‐scoring lncRNAs which are expressed in a PD model of SNCA‐overexpressing MPNCs (GSE70368), (edgeR statistical analysis, significance not corrected for multiple comparisons; C130071C03Rik is a murine homolog of LINC00461). (f) mRNA levels for three SN and murine model DE lncRNAs in a larger cohort of human SN (control n = 24; PD n = 29), determined by qPCR (RMST— not significant; NEAT1 and LINC‐PINT—p < .05; Mann–Whitney single‐tail U test; solid bars: controls, striped bars: PD; % median of control group)