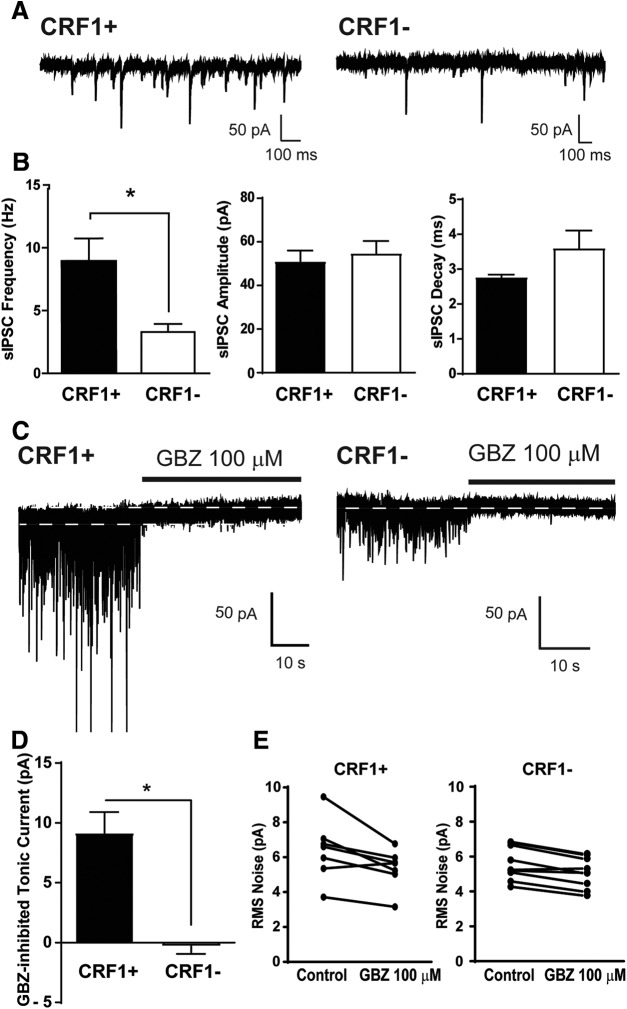
Figure 4.
Phasic and tonic inhibitory transmission in CRF1 lateral amygdala neurons. A, Representative voltage-clamp recording of a CRF1+ cell (left) and a CRF1− cell (right). B, Summary of sIPSC frequency (left), amplitude (center), and decay (right) of CRF1+ and CRF1− cells. *p < 0.05 by unpaired t test comparing CRF1+ to CRF1− cells. C, Representative voltage-clamp recording of a CRF1+ cell (left) and a CRF1− cell (right) during GBZ superfusion (100 μm). White dashed line indicates level of holding current before and after GBZ superfusion. D, Summary of the tonic current revealed by gabazine. *p < 0.05 by unpaired t test comparing CRF1+ to CRF1− cells. E, Summary of the change in rms noise induced by gabazine superfusion in CRF1+ (left) and CRF1− (right) cells.

