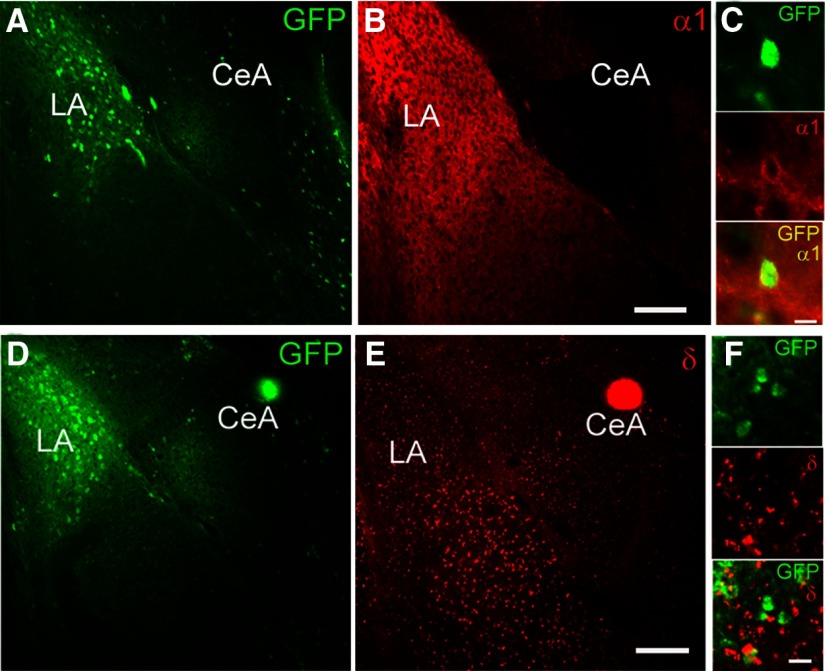
Figure 5.
GABAA subunit expression in CRF1+ and CRF1− lateral amygdala neurons. A, Photomicrograph (10×) of GFP expression (green fluorescence) in LA. B, Photomicrograph (10×) of α1 GABAA receptor subunit expression (red fluorescence) in LA. Scale bar, 100 μm. C, Photomicrograph (60×) of GFP expression (top), α1 expression (center), and merge (bottom) in LA highlighting a single cell exhibiting coexpression of GFP and α1. Scale bar, 10 μm. D, Photomicrograph (10×) of GFP expression (green fluorescence) in LA. E, Photomicrograph (10×) of δ GABAA receptor subunit expression (red fluorescence) in LA. Scale bar, 100 μm. F, Photomicrograph (60×) of GFP expression (top), δ expression (center), and merge (bottom) in LA. Scale bar, 10 μm.

