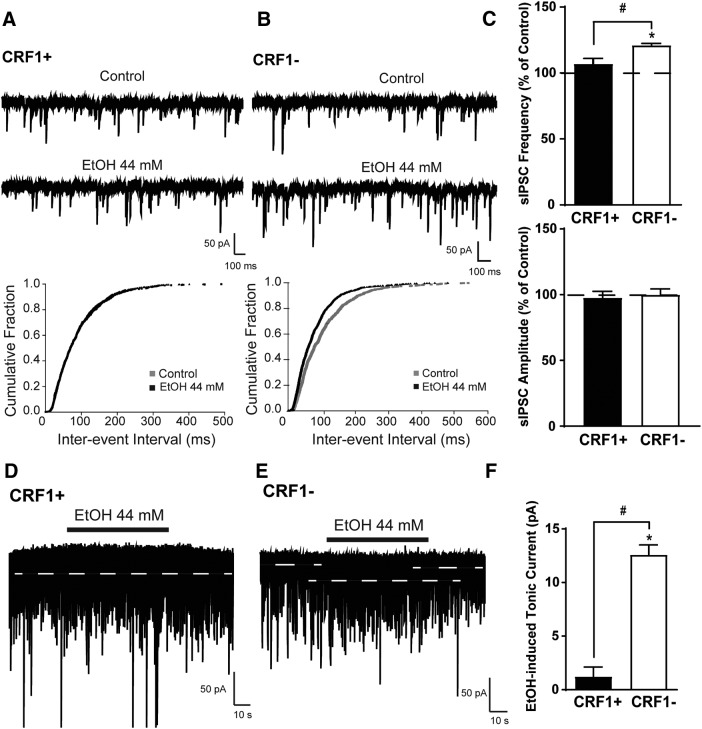
Figure 7.
Effects of acute ethanol exposure on phasic and tonic inhibitory transmission in CRF1+ and CRF1− lateral amygdala neurons. A, Representative voltage-clamp recording (top) and cumulative probability histogram of interevent interval (bottom) of a CRF1+ cell during superfusion of EtOH (44 mm). B, Representative voltage-clamp recording (top) and cumulative probability histogram of interevent interval (bottom) of a CRF1− cell during superfusion of EtOH (44 mm). C, Summary of the change in sIPSC frequency (top) and amplitude (bottom) following ethanol superfusion compared with baseline in CRF1+ and CRF1− cells. *p < 0.05 by one-sample t test comparing differences from baseline within cell type; #p < 0.05 by unpaired t test comparing CRF1+ to CRF1− cells. D, Representative voltage-clamp recording of a CRF1+ cell during superfusion of EtOH (44 mm). White dashed line indicates the level of holding current before and after EtOH superfusion. E, Representative voltage-clamp recording of a CRF1− cell during superfusion of EtOH (44 mm). White dashed line indicates the level of holding current before and after EtOH superfusion. F, Summary of the tonic current induced by ethanol in CRF1+ and CRF1− cells. *p < 0.05 by one-sample t test comparing differences from baseline within cell type; #p < 0.05 by unpaired t test comparing CRF1+ to CRF1− cells.

