. 2020 Jan 21;11(8):2260–2268. doi: 10.1039/c9sc05487a

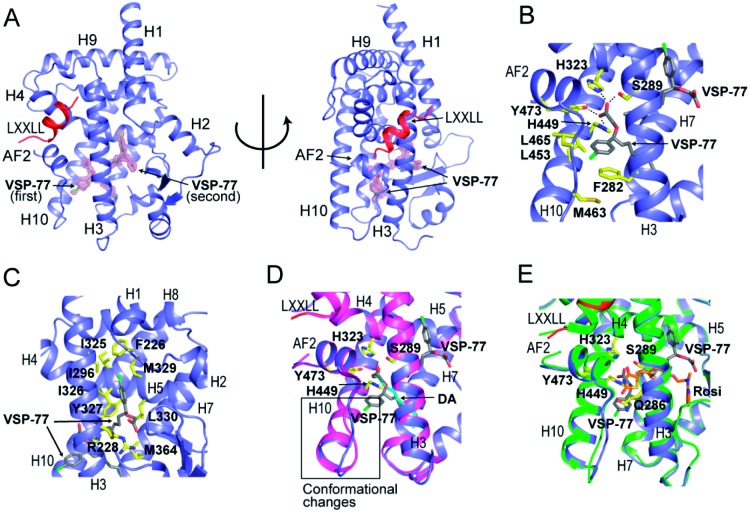
Fig. 8. Crystal structure of PPARγ LBD in complex with (S)-VSP-77 and an LXXLL motif from PGC1, in which PPARγ isoform 1 was used for this study. (A) The overall complex crystal structure in two views. PPARγ LBD is colored in blue, the LXXLL motif in red, and the two molecules of (S)-VSP-77 are colored in gray and covered with a 2FoFc model map contoured to one sigma. (B) Binding mode of the first (S)-VSP-77 molecule. (S)-VSP-77 is colored in gray, and the protein residues interacting with (S)-VSP-77 are shown in yellow stick representation. The hydrogen bonds between the carboxyl group of the ligand and receptor residues are indicated by dashed lines. (C) Binding mode of the second (S)-VSP-77 molecule; same color code as that in panel B. (D) Superposition of (S)-VSP-77-bound (blue) with DA-bound (magenta) PPARγ LBD structures. (S)-VSP-77 is colored in gray, and DA is colored in cyan. The extra chlorophenyl group of (S)-VSP-77 causes conformational differences in the C-terminus of helix 10 and the following loop of the PPARγ LBD compared to those of DA-bound receptor. (E) Superposition of (S)-VSP-77-bound (blue) with Rosi-bound (green) PPARγ LBD structures. (S)-VSP-77 is colored in gray, and Rosi is in brown.

Fig. 8