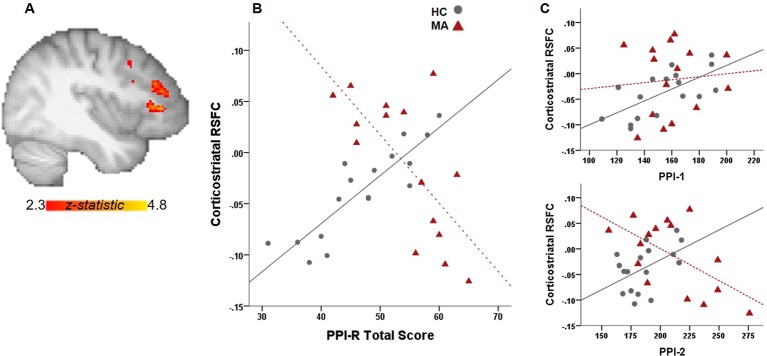
Figure 1.
Relationship between PPI total scores and RSFC. (A) Whole-brain connectivity analysis with a ventral striatal seed show significant group interactions with PPI-R total scores on corticostriatal connectivity. (B) Scatter plot illustrates the relationship between RSFC and PPI-R total scores for each group. (C) Significant group interactions on corticostriatal RSFC with PPI-R subscales.

