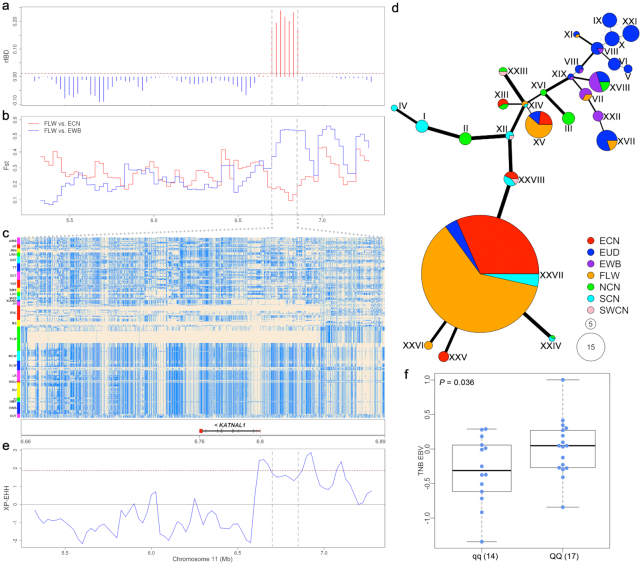
Figure 4:
Introgression at the KATNAL1 locus. (a) rIBD values in a 2-Mb region encompassing the KATNAL1 gene. The brown dashed line indicates the 5% threshold line, and the KATNAL1 region is indicated by grey dashed lines. (b) Genetic differentiation index (FST) between French Large White (FLW) and European wild boar (EWB) or East Chinese (ECN) pigs. (c) Haplotype heat map of the KATNAL1 region. Major and minor alleles in FLW pigs are indicated by beige and light blue, respectively. (d) Haplotype network in the KATNAL1 region. Each circle represents a haplotype, and the size of the circle is proportional to the haplotype frequency. The line width and length represent the difference between haplotypes. Different colors represent pigs from different geographical regions. EUD: European domestic pig; FLW: French Large White; EWB: European wild boar; NCN: North Chinese pig; SCN: South Chinese pig; SWCN: Southwest Chinese pig. (e) Selection signals by XP-EHH analysis between FLW and other Large White pigs. The brown dashed line indicates the 5% threshold line. (f) Estimated breeding values for total number of piglets born (EBV_TNB) of FLW sows that mated with FLW boars homozygous (QQ) or heterozygous (Qq) for the introgressed haplotypes. The Student t-test was used to compute the P-value (P = 0.036). The interquartile range and median are indicated by box and bold horizontal line. The top horizontal bar represents the largest value within 1.5 times interquartile range above 75th percentile, and the botton horizontal bar represents the smallest value within 1.5 times interquartile range below 25th percentile. The blue points indicate the EBV_TNB of the samples.

