Fig. 5.

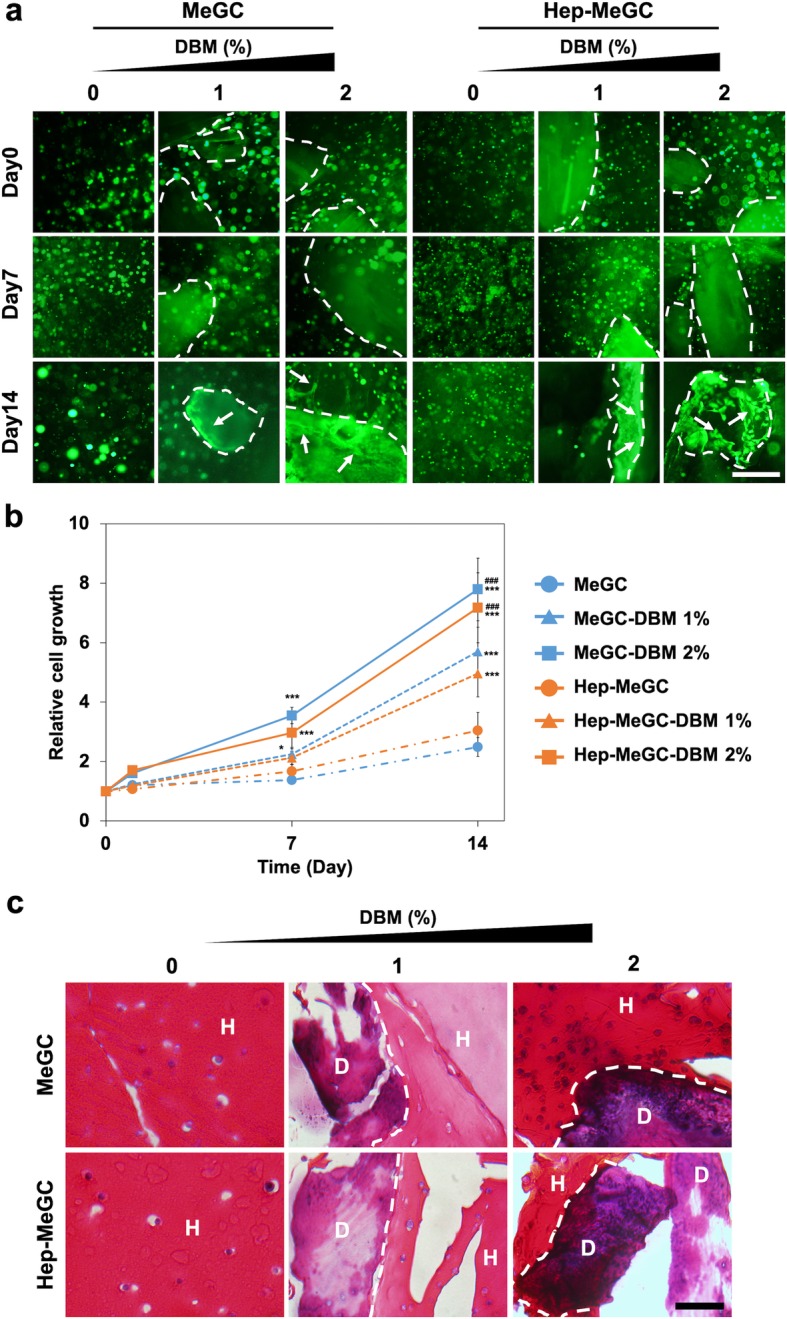
Proliferative potential of BMSCs in hydrogel-DBM composites. a Morphological observation of BMSCs in composites. Dotted lines demarcate the DBM/hydrogel interface and arrows point to spreading cells. Scale bar is 200 μm. b The proliferative potential of BMSCs measured by alamarBlue. (*) compared to MeGC or Hep-MeGC and (#) compared to MeGC-DBM 1% or Hep-MeGC-DBM 1%. *p < 0.05, ***p < 0.001, and ###p < 0.001. c H&E staining images of BMSCs cultured in composites for 2 weeks to observe the internal structure of cells and composites. Dotted lines demarcate the DBM/hydrogel interface (H: Hydrogel, D: DBM). Scale bar is 50 μm
