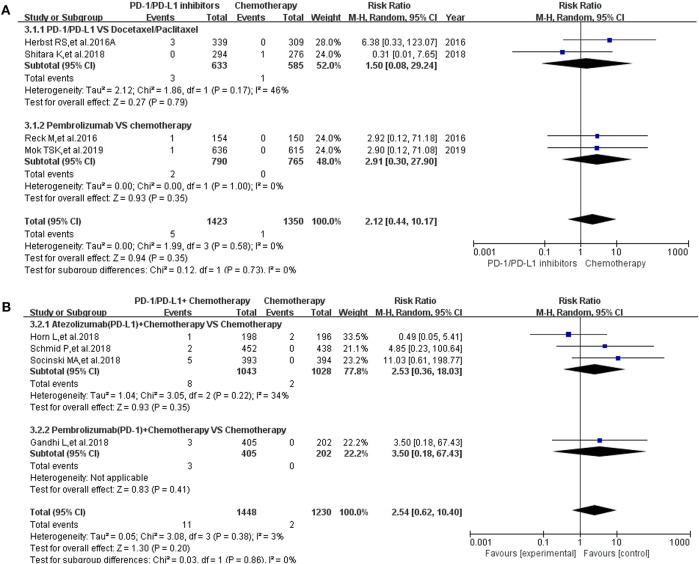
Figure 5.
Forest plots for the risk ratio of pancreatitis for all grade. (A) Forest plots for the risk ratio of treatment related pancreatitis (PD-1/PD-L1 vs. Docetaxel/Paclitaxel or Chemotherapy). Subgroup analysis was performed according to the composition of chemotherapy in the control group. (B) Forest plots for the risk ratio of treatment related pancreatitis (PD-1/PD-L1 + Chemotherapy vs. Chemotherapy). Subgroup analysis was performed based on the drug type (PD-1 or PD-L1) of the experimental group.

