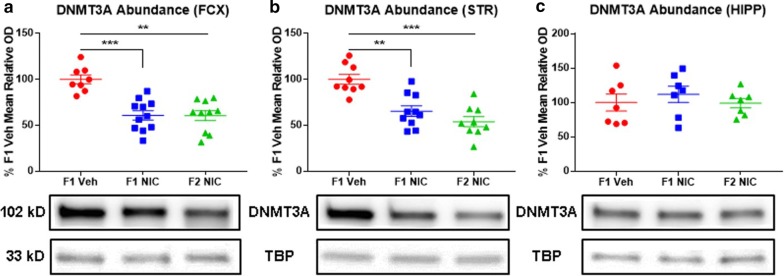
Fig. 2.
DNE elicits multigenerational DNMT3A deficits in the frontal cortices and striata. Representative Western blot images and densitometric measurements of DNMT3A abundance in frontal cortices (nF1Veh = 8, nF1NIC = 11, and nF2NIC = 10), striata (nF1Veh = 9, nF1NIC = 10, and nF2NIC = 9), and hippocampi (nF1Veh = 7, nF1NIC = 7, and nF2NIC = 7). a DNMT3A abundance in frontal cortices. F1 NIC and F2 NIC mice have reduced frontal cortical DNMT3A content. b DNMT3A abundance in striata. F1 NIC and F2 mice NIC have reduced striatal DNMT3A content. c DNMT3A abundance in hippocampi. Hippocampal DNMT3A content is unaltered in F1 NIC and F2 NIC mice. FCX frontal cortices, STR striata, HIPP hippocampi, DNMT3A DNA methyltransferase 3A, TBP TATA-binding protein. All data are mean ± SEM. *p < 0.05; **p < 0.01; ***p < 0.001; ****p < 0.0001

