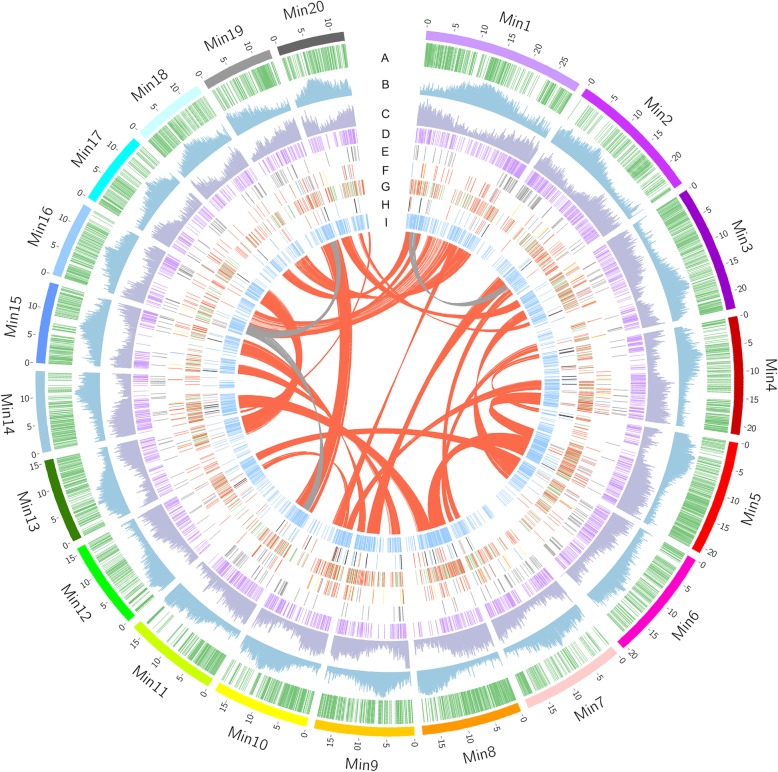
Fig. 1.
Overview of the mango (Mangifera indica) genome assembly. The outer layer of colored blocks is a circular representation of the 20 pseudomolecules, with thick mark labeling each 5 Mb. The distribution of genetic markers mapped to mango chromosomes is shown in (A). Repeat density (B) and gene density (C) are calculated in 100-kb windows sliding in 10-kb steps. Tandem duplicated genes are displayed in (D). Genes involved in disease resistance (E), pigment-related metabolisms (F, yellow lines represent carotenoid synthesis genes, green lines represent chl metabolism genes and red lines represent anthocyanin synthesis genes), lipid metabolism (G, red lines represent genes participant in the synthesis of triacylglycerol, sphingolipid, phospholipid and mitochondrial lipopolysaccharide, phospholipid signaling, and lipid trafficking; the green lines represent the rest lipid metabolism genes) and photosynthesis related genes (H, red lines represent photosystem genes, black lines represent the Calvin cycle genes, and green lines represent genes participant in sucrose and starch synthesis, glycolysis, and Krebs cycle) are also displayed. Transcription factors are shown in (I). The innermost layer shows inter-chromosomal synteny, with the red links representing syntenic blocks retained after a recent WGD in mango genome, and the gray links representing homologs as results of older WGD

