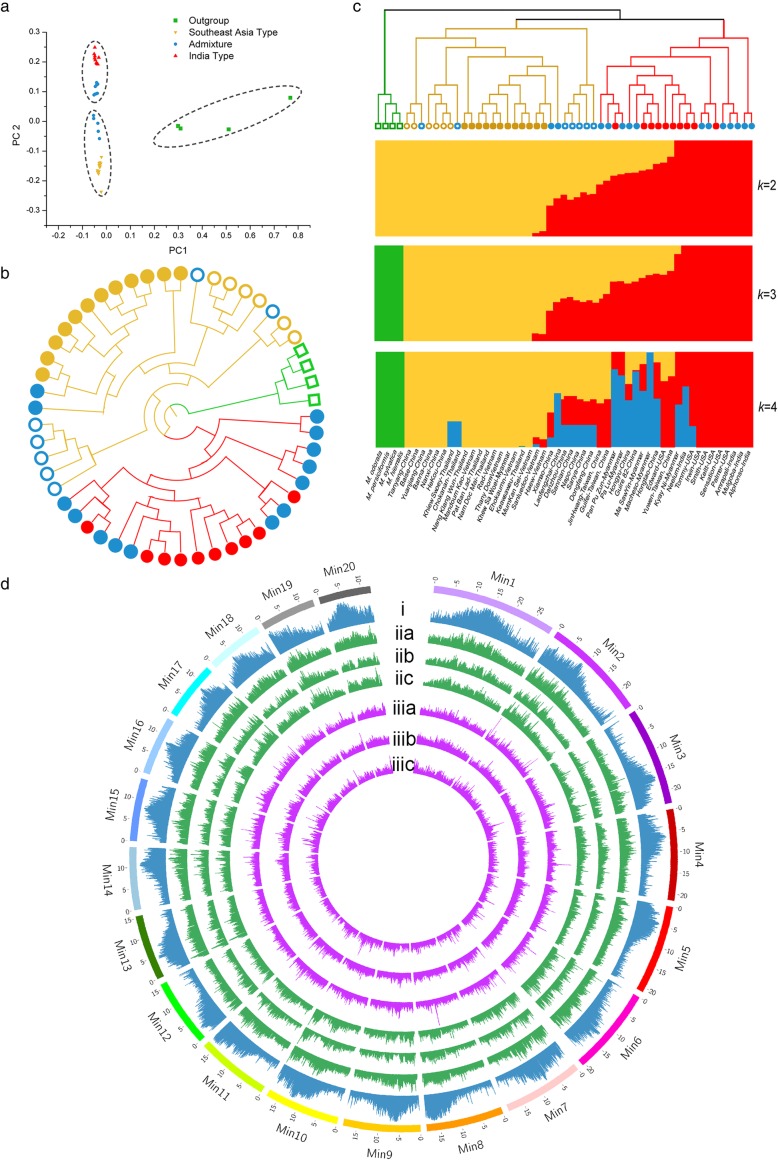
Fig. 5.
Genomic diversity of M. indica varieties and relatives within Mangifera. 49 M. indica germplasms and 4 otherspecies in the genus of Mangifera were sampled for the analyses. (a) PCA analysis of the samples using SNP markers. The three groups indicated by phylogenetic (b) and STRUCTURE (k=3) (c) analyses were circled, respectively. Germplasms with different backgrounds are represented with dots with different shapes and colors. (b) Neighbor-joining phylogenetic tree of the samples in polar layout based on SNPs. Clades of the three major groups are indicated with different colors as indicated in STRUCTURE analysis (k=3). Tips of outgroup germplasms are indicated with green hollow blocks. Tips of traditional and commercial varieties are labeled with filled rounds, and those representing landraces are suggested as hollow circular forms. Traditional varieties and commercial cultivars without admixture are labeled in red, and germplasms representing Southeast Asia varieties and landraces are in yellow, while those with allele admixture are in blue. (c) STRUCTURE analysis of the samples, with each color representing one population, and the length of each color segment in each vertical bar representing the proportion contributed by ancestral populations. On the right is assumed number of clusters (k), and below is the name or origin of the samples. (d) Circos demonstration of genetic diversity. Outer circle represents 20 pseudo-molecules of mango genome. i, contents of repetitive elements; iia- iic, nucleotide diversity (π) of other Mangifera species, varieties of Southeast Asia and India germplasms, respectively. iiia-iiic, population differentiation (FST) levels of other Mangifera species vs. germplasms of Southeast Asia, other Mangifera species vs. India germplasms, and those of Southeast Asia vs. India, respectively

