Fig. 4.
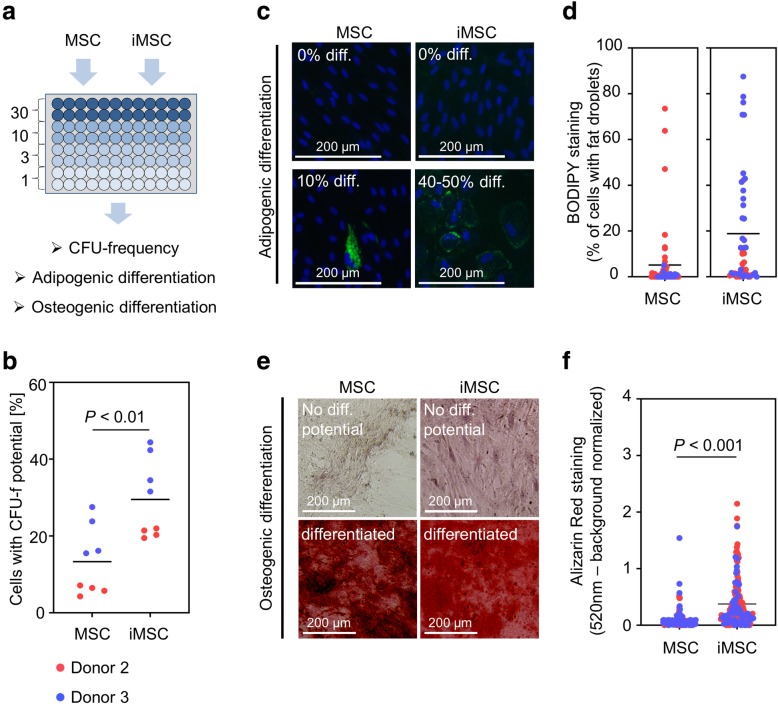
Functional analysis of subpopulations in MSCs and iMSCs. a Schematic presentation of limiting dilution assays. Either primary MSCs or iMSCs of two corresponding donors were used. Cells were seeded on four 96-well plates at decreasing concentrations (30, 10, 3, and 1 cells/well). After 15 days of incubation, wells were scored for at least 50% confluency to determine CFU-f frequencies. The same plates were then induced towards adipogenic and osteogenic lineage to compare in vitro differentiation potential. b Analysis of CFU-f frequencies of MSCs and iMSCs (N = 2; n = 4). c Representative pictures of subclones without and with adipogenic differentiation potential (BODIPY/Hoechst staining 14 days after induction of differentiation; donor 3). d For individual MSC and iMSC subclones, the percentage of cells with fat droplet formation upon adipogenic differentiation was analyzed. Due to different morphology of fat droplets the results were not directly compared in one diagram. e Representative pictures of subclones without and with osteogenic differentiation potential (Alizarin Red staining 18 days after induction of osteogenic differentiation; donor 3). f Osteogenic differentiation was quantified for individual subclones in MSCs and iMSCs. Alizarin Red staining was measured by background normalized absorption

