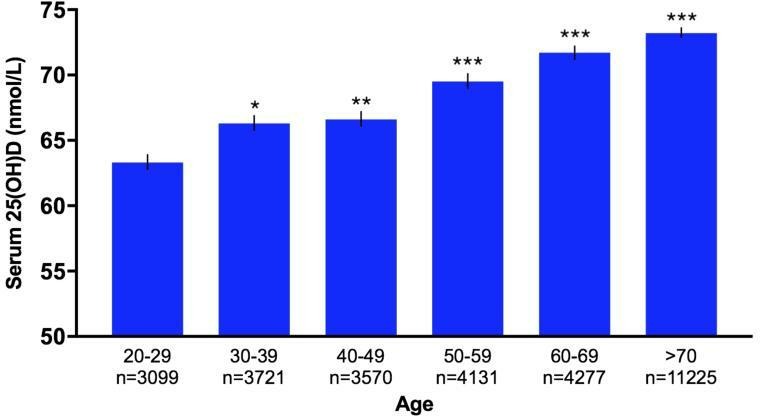
Figure 2.

Bar graph of age variation in serum 25(OH)D levels in study population (n=30 023). Bar graph showing age variation in serum 25(OH)D levels (nmol/L) of 30 023 patients at Royal Melbourne Hospital, Victoria, Australia between 2014 and 2017. 25(OH)D levels increased with age, and patients≥50 years had significantly higher mean 25(OH)D concentrations compared with patients aged 20–29 years. Error bars represent SEM. Statistical significance of p values: p<0.05; *p<0.01; **p<0.001; ***p<0.0001.
