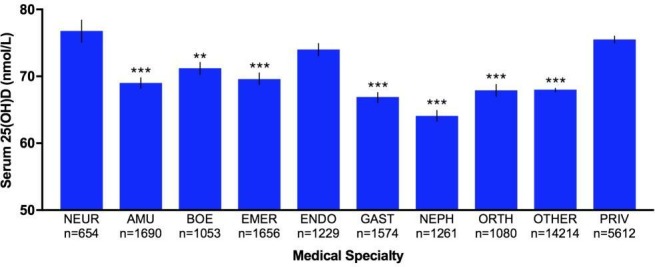
Figure 3.

Bar graph of variations in serum 25(OH)D level of patients admitted to various medical specialties (n=30 023). Bar graph showing variation in serum 25(OH)D levels (nmol/L) of 30 023 patients admitted to all medical specialties at Royal Melbourne Hospital, Victoria, Australia between 2014 and 2017. Specialties with <1000 patients (except for NEUR) were placed into OTHER for analysis. Analysis showed the average 25(OH)D levels of patients from all other specialties were significantly lower compared with NEUR except ENDO and PRIV. Error bars represent SEM. Statistical significance of p values: p<0.05; *p<0.01; **p<0.001; ***p<0.0001. AMU, acute medical unit; BOE, breast/oncology/endocrine surgery; EMER, emergency; ENDO, endocrinology; GAST, gastroenterology; NEPH, nephrology; NEUR, neurology; ORTH, orthopaedic; PRIV, private.
