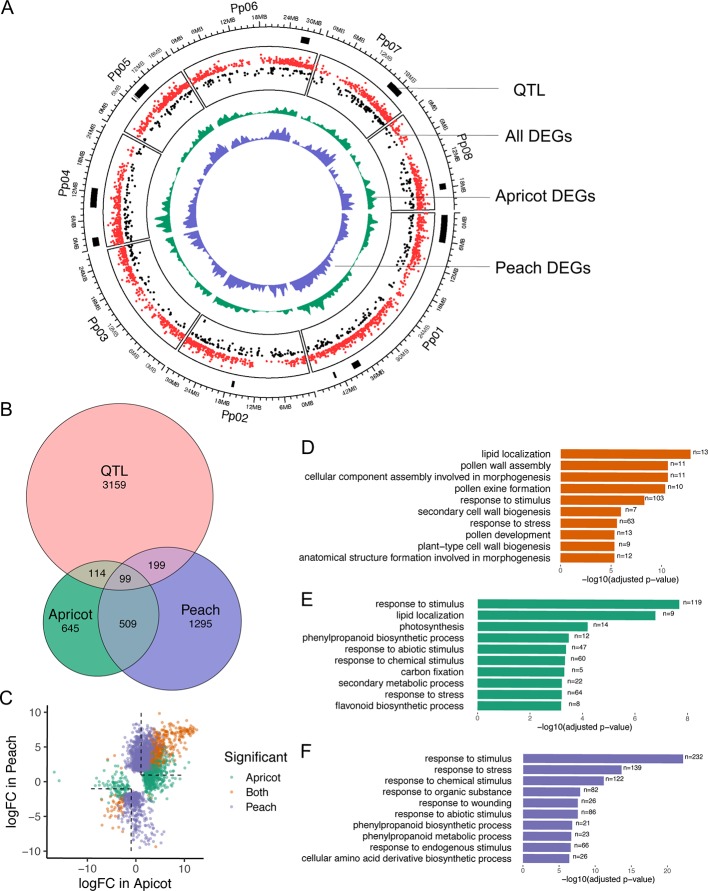
Figure 6.
Comparison of differentially expressed genes (DEGs) between endodormancy and ecodormancy in apricot and peach. (A) The distribution of DEGs and quantitative trait loci (QTLs) on the reference genome. Red and black dots represent up and down fold changes, respectively. (B) Venn diagram of apricot and peach DEGs overlapping with peach CR QTLs. (C) A comparison between DEGs in apricot and peach based on the log2-fold change (logFC). Colors indicate genes that were statistically significant in apricot only (green), peach only (purple), or both (orange). (D–F) Top 10 GO terms enriched in DEGs found in both species (D), peach only (E), and apricot only (F).

