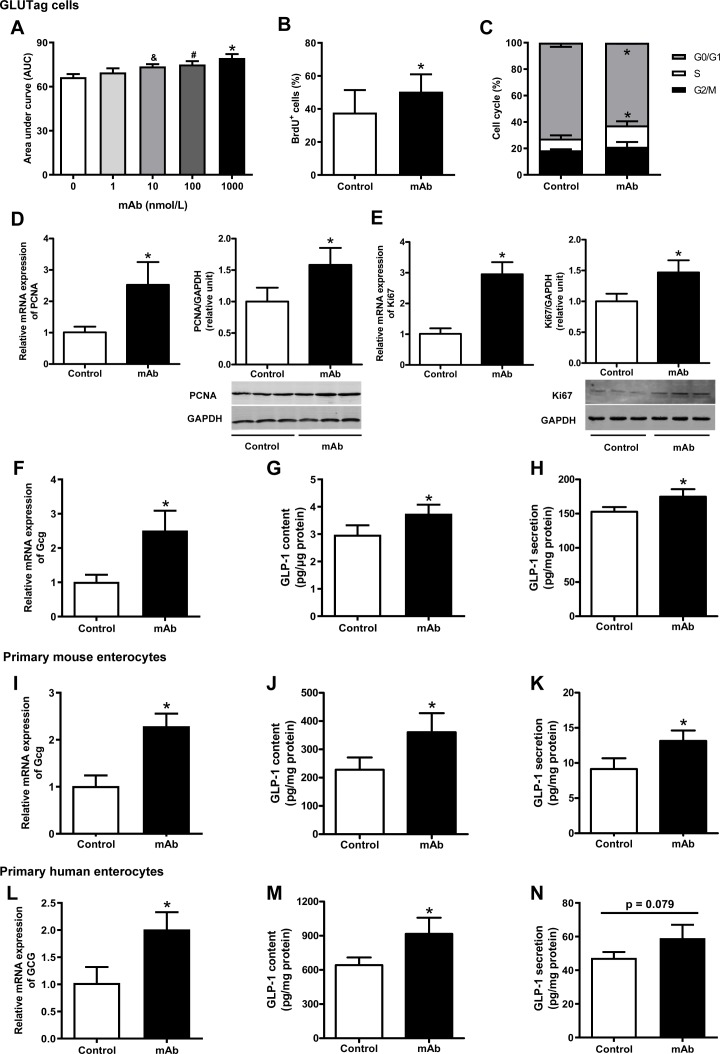
Figure 4.
Detection of cell proliferation and GLP-1 production in mouse L-cell line GLUTag cells, and primary mouse and human enterocytes cultured with GCGR mAb or vehicle. (A) GLUTag cells were incubated with GCGR mAb (1, 10, 100 and 1000 nmol/L) for different time periods (6, 12, 24 and 48 hours). Cell proliferation was measured using the Cell Counting Kit-8 assay and the area under the curve during 24 hours was calculated. (B) Quantification of BrdU-positive cells per total cells after a 24-hour GCGR mAb (1000 nmol/L) or vehicle treatment following 12-hour BrdU incorporation. (C) Cell cycle distributions determined by flow cytometry after treatment with GCGR mAb (1000 nmol/L) or vehicle for 24 hours. (D, E) Relative mRNA and protein levels of the cell proliferation markers PCNA (D) and Ki67 (E) were detected by qRT-PCR and western blot after cells were cultured with 1000 nmol/L GCGR mAb for 24 hours. (F–N) Proglucagon (GCG) expression and GLP-1 production in GLUTag cells (F–H), primary mouse enterocytes (I–K), and primary human enterocytes (L–N) cultured with GCGR mAb (1000 nmol/L) or vehicle for 24 hours. Relative mRNA levels of GCG were detected by qRT-PCR (F, I, L), and intracellular (G, J, M) and supernatant (H, K, N) GLP-1 protein levels were measured by ELISA. Data were obtained from at least three independent experiments and are presented as mean±SD. Statistical analysis was conducted by one-way analysis of variance followed by post-hoc Tukey-Kramer test or Student’s t-test when appropriate. Data in A: *p<0.05 (1000 nmol/L versus control); #p<0.05 (100 nmol/L versus control); &p<0.05 (10 nmol/L versus control). Data in B–N: *p<0.05 versus control. BrdU, 5-bromo-2’-deoxyuridine; GAPDH, glyceraldehyde-3-phosphate dehydrogenase; GCG, proglucagon; GCGR, glucagon receptor; GLP-1, glucagon-like peptide-1; mAb, monoclonal antibody; mRNA, messenger RNA; PCNA, proliferating cell nuclear antigen; qRT-PCR, quantitative reverse transcription PCR.

