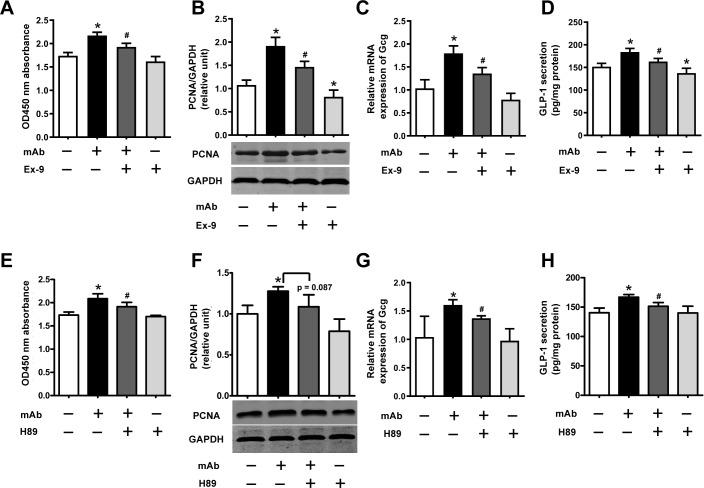
Figure 5.
Signaling pathways involved in the GCGR mAb-induced L-cell proliferation and GLP-1 production. GLUTag cells were preincubated with the GLP-1R antagonist exendin (9–39) (Ex-9; 200 nmol/L) or PKA inhibitor H89 (10 μmol/L) for 30 min and then coincubated with 1000 nmol/L GCGR mAb for an additional 23.5 hours. (A, E) Cell proliferation was measured using the Cell Counting Kit-8 assay. (B, F) The protein levels of PCNA were determined by western blot. (C, G) Relative mRNA expression of Gcg was detected by qRT-PCR. (D, H) Supernatant GLP-1 protein levels were assayed by ELISA. Data are presented as mean±SD. n=6 in A–D, and n=3 in E–H. Statistical analysis was conducted using one-way analysis of variance followed by post-hoc Tukey-Kramer test; *p<0.05 versus control; #p<0.05 versus GCGR mAb. GAPDH, glyceraldehyde-3-phosphate dehydrogenase; GCG, proglucagon; GCGR, glucagon receptor; GLP-1, glucagon-like peptide-1; GLP-1R, GLP-1 receptor; mAb, monoclonal antibody; mRNA, messenger RNA; PCNA, proliferating cell nuclear antigen; PKA, protein kinase A; qRT-PCR, quantitative reverse transcription PCR.

