FIGURE 1.
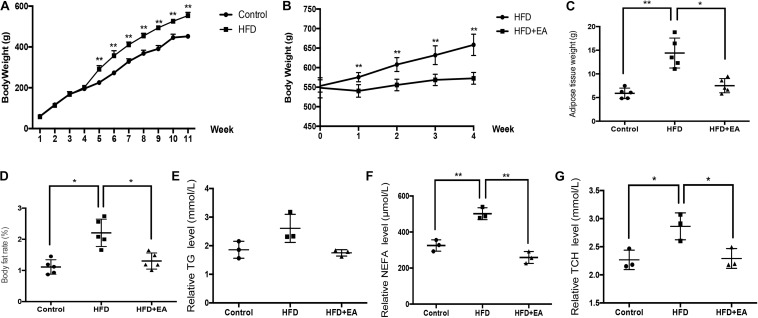
Effect of EA on body weight, adipose weight, body fat rate, and lipid levels. (A) Body weight of rats from the normal diet (control) and high-fat diet (HFD) groups after 11 weeks (n = 5, **P < 0.01). (B) Body weight of HFD rats with or without EA after feeding for 11 weeks and initiation of EA treatment. (C) White adipose tissue weight in the control group, HFD group, and HFD + EA group (n = 5, *P < 0.05, **P < 0.01). (D) Body fat rate (adipose tissue weight/body weight) of the control group, HFD group, and HFD + EA group (n = 5, *P < 0.05). (E) Relative serum TG level of the control group, HFD group, and HFD + EA group (n = 3). (F) Relative serum NEFA level of the control group, HFD group, and HFD + EA group (n = 3, **P < 0.01). (G) Relative serum TCH level of the control group, HFD group, and HFD + EA group (n = 3, *P < 0.05).

