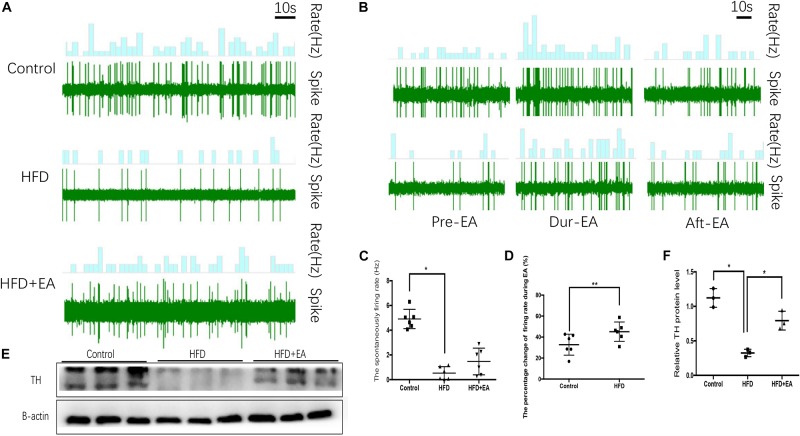
FIGURE 2.
Effect of EA on SNS firing in iWAT. (A) Waveform representing spontaneous discharge of the SNS in iWAT (control, HFD, and HFD + EA groups). (B) Waveform representing spontaneous discharge during EA in the control and HFD group. (C) Frequency of spontaneous discharge in the control, HFD, and HFD + EA groups (n = 6, *P < 0.05). (D) Percentage change in the firing rate during EA in the control and HFD group (n = 6, **P < 0.01). (E) Immunoblot image of TH staining. (F) Relative protein level of TH in iWAT (in the control, HFD, and HFD + EA groups) (n = 3, *P < 0.05).

