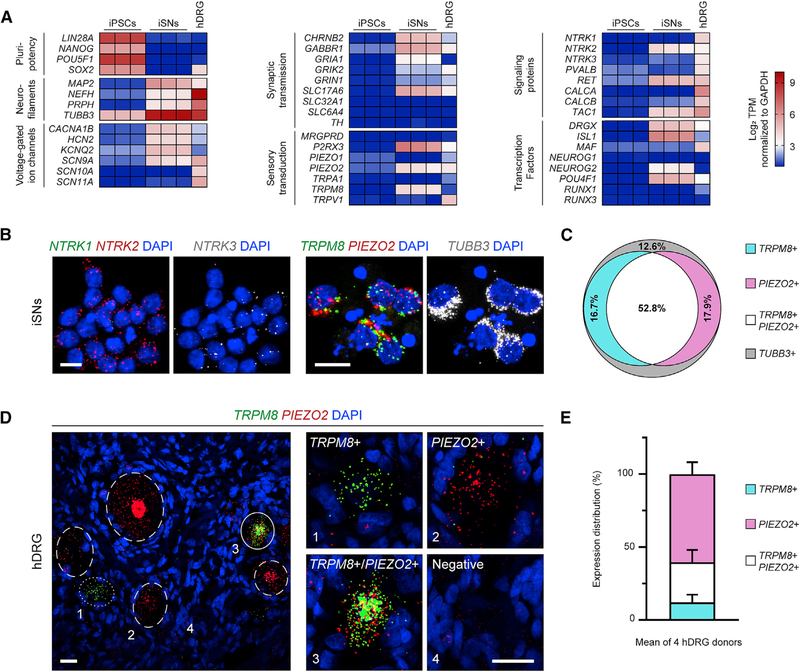
Figure 2. iSNs and Human DRG Neurons Co-express TRPM8 and PIEZO2.
(A) Heatmap of RNA sequencing results on iPSCs, iSNs, and adult human donor DRG (hDRG). Each column represents an individual sample’s normalized log2 transcripts per million (TPM). The hDRG is a pooled RNA sample from 21 individuals.
(B) RNA in situ hybridization on iSNs for transcripts of neurotrophin and sensory receptors. Each small fluorescent punctum roughly indicates one transcript. TUBB3 encodes a general neuron class of microtubule, βIII-tubulin. Scale bars, 10 μm.
(C) Quantification of in situ hybridization in iSNs using a cutoff criteria of ≥ 5 puncta per transcript for positive cells. TRPM8+ (17.9% ± 1.5%), PIEZO2+ (14.0% ± 4.6%), TRPM8+/PIEZO2+ (56.0% ± 6.3%), and TUBB3+ only (11.5% ± 3.4%). 199 cells were counted across n = 5 coverslips.
(D) RNA in situ hybridization for TRPM8 and PIEZO2 in human DRG (hDRG). Labeled neurons are shown in wide-field view (left) with dotted, dashed, and solid circles indicating TRPM8+, PIEZO2+, and TRPM8+/PIEZO2+ neurons, respectively. Zoomed images of single neurons (right), individually marked by numbers in the wide-field view. Scale bars, 25 μm.
(E) Quantification of human DRG in situ hybridization. TRPM8+ (12.8% ± 4.4%), PIEZO2+ (59.7% ± 6.8%), and TRPM8+/PIEZO2+ (27.4% ± 6.9%). 622 positive cells were counted across n = 4 DRG donors. All values are expressed as mean ± SEM.

