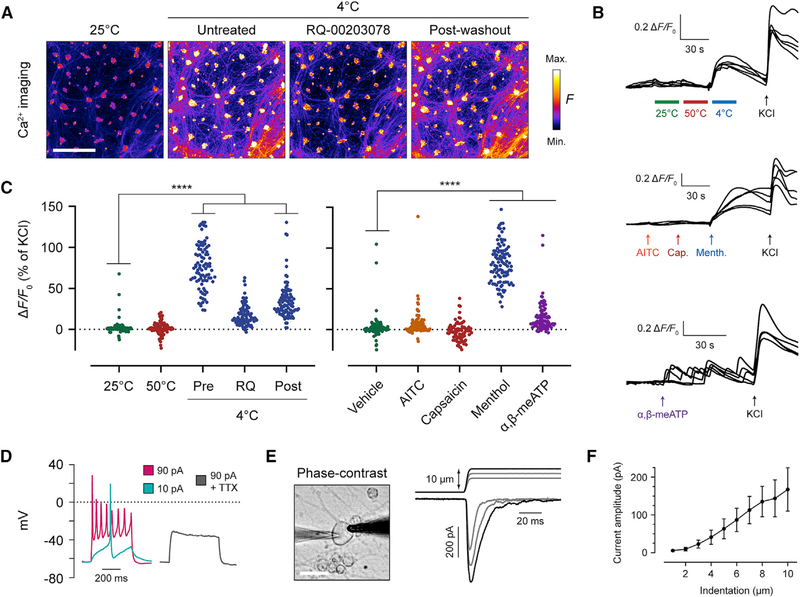
Figure 3. iSNs Detect Cold Temperature and Mechanical Force.
(A) Fluo-4 fluorescence images recording iSNs at 25°C and 4°C. The TRPM8 inhibitor RQ-00203078 was incubated at 10 μM for 5 min before resuming recording. A 5-min room temperature incubation was used in between each 4°C treatment. Scale bar, 500 μm.
(B) Representative fluorescence traces of calcium imaging trials, with 5 cells shown per trial. Values are graphed as the change in fluorescence intensity from baseline and divided by the baseline (ΔF/F0). 100 μM AITC, 10 μM capsaicin, 500 μM menthol, and 50 μM α,β-methylene-ATP (α,β-meATP) were used.
(C) Scatter dot plots of peak ΔF/F0 of individual cells after application of temperature or chemicals. Each cell is normalized to a percentage of its own KCl response at the end of the recording period. For each condition, ≥ 80 cells were analyzed. Post hoc comparisons of each treatment to vehicle with one-way ANOVA and Dunnett’s correction for multiple comparisons. p values: 50°C, p = 0.99; 4°C pre, p = 0.0001; 4°C RQ, p = 0.5135; 4°C post, p = 0.001; AITC, p = 0.1379; capsaicin, p = 0.5242; menthol, p = 0.0001; α,β-meATP, p = 0.0001. ****p < 0.0001.
(D) Example whole-cell current-clamp recording of iSNs in response to depolarizing currents. A total of n = 4 cells were recorded without tetrodotoxin (TTX) andn = 5 cells with 1 μM TTX.
(E) Mechanical stimulation of iSNs in whole-cell voltage-clamp mode. In the phase-contrast image, the recording pipette is on the left, and the stimulator probe is on the right. Scale bar, 20 μm. In the recording, the top trace indicates micrometer steps of the stimulator probe, whereas the bottom trace shows whole-cell currents.
(F) Quantification of the current amplitude at each probe indentation depth. A total of n = 10 cells were recorded, with 10/10 cells displaying a peak mechanically evoked current above 50 pA. Values are expressed as mean ± SEM.

