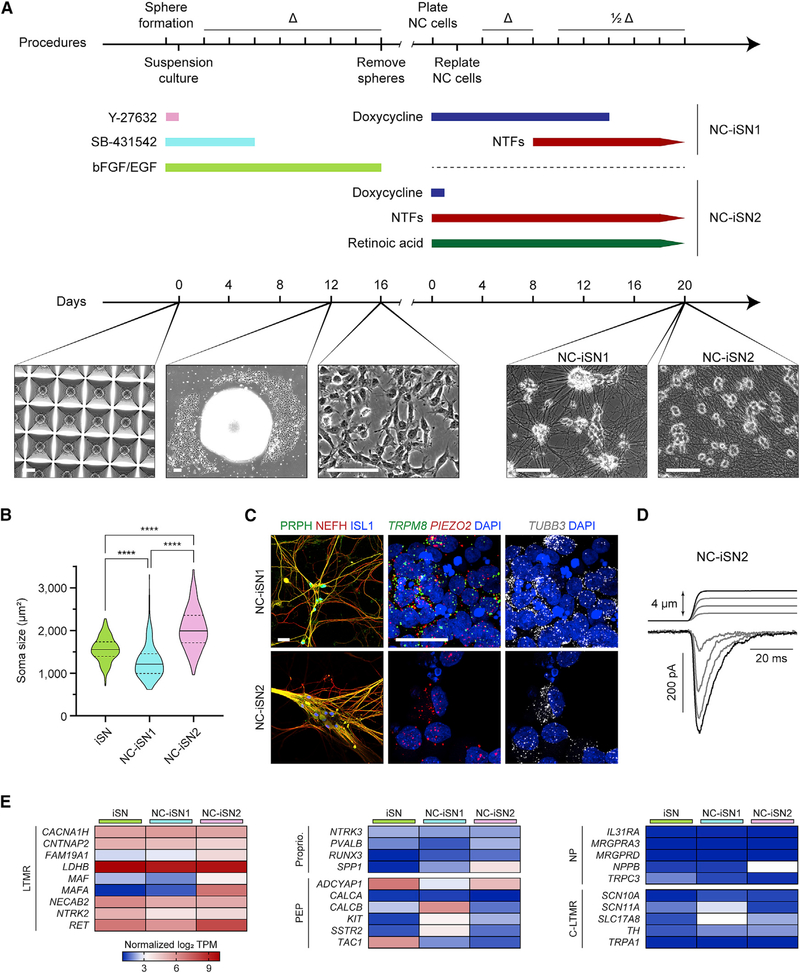
Figure 4. Varied Induction of NGN2-BRN3A in Neural Crest Yields Divergent Sensory Neuron Populations.
(A) Protocol and phase-contrast images of neural crest differentiation with two strategies for sensory neuron induction (NC-iSN1 and NC-iSN2). Day 0 depicts neurectodermal spheroid formation in a microwell plate. Day 12 shows neural crest migration from an individual spheroid. Scale bars, 100 μm.
(B) Quantification of cell soma area based on phase-contrast images across three differentiation experiments of iSNs (n = 301 cells), NC-iSN1s (n = 228 cells), and NC-iSN2s (n = 332 cells). Values are expressed as mean ± SEM. Post hoc comparisons with Kruskal-Wallis test and Dunn’s correction for multiple comparisons, ****p < 0.0001.
(C) Representative immunohistochemistry and RNA in situ hybridization experiments on NC-iSN1s and NC-iSN2s. Scale bars, 25 μm.
(D) Representative mechanical stimulation of NC-iSN2s in whole-cell voltage-clamp. A total of n = 6 cells were recorded.
(E) RNA sequencing heatmap expression results of selected genes grouped by known sensory neuron subtype. Each heatmap column depicts the average log2 TPM of three independent samples.
Δ, medium change; 1/2Δ, half medium change; C-LTMR, C fiber LTMR; LTMR, low-threshold mechanoreceptor; NC, neural crest; NP, nonpeptidergic nociceptor; PEP, peptidergic nociceptor; Proprio., proprioceptor. See also Figure S3.

