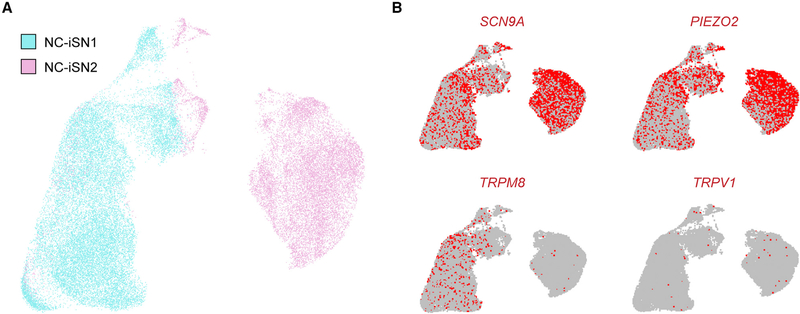
Figure 5. Single-Cell RNA Sequencing of Neural Crest-Derived iSNs.
(A) Merged UMAP plot representing individual cells from a single differentiation of both NC-iSN1 (22,804 cells) and NC-iSN2 (15,004 cells).
(B) Expression UMAP plots indicating cells in the upper 90% of the population distribution with mapped reads to specific genes, based on unique molecular identifier counts.

