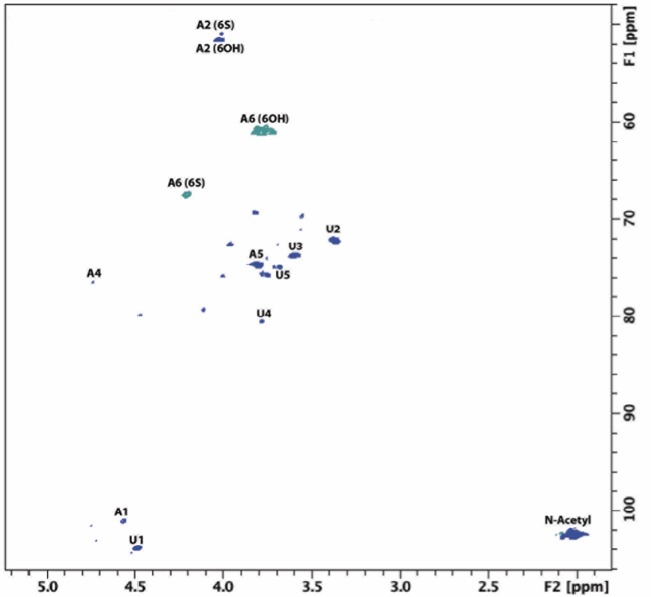
Figure 4.

Nuclear magnetic resonance spectra (heteronuclear single quantum coherence) for S. pilchardus F4.
Chondroitin sulfate-associated major signals are indicated. Spectral integration was carried out using labelled signals. A: Galactosamine; U: uronic acid. Minor peaks are observed but with low intensity meaning that their abundance is lower than 5%. F1 and F2 are the indirect and direct dimensions, respectively.
