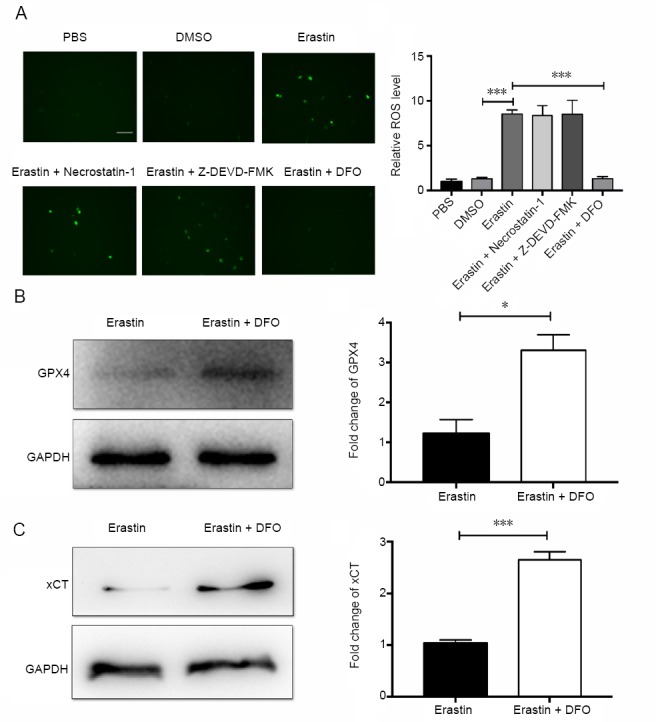
Figure 5.

DFO decreases ROS levels and upregulates GPX4 and xCT.
(A) Effect of the apoptosis inhibitor Z-DEVD-FMK (50 μM), the necroptosis inhibitor necrostatin-1 (50 μM) and DFO (50 μM) on the production of ROS after pretreatment for 12 hours followed by erastin treatment for 48 hours: ROS levels were measured by immunofluorescence microscopy. ROS levels were significantly reduced after DFO treatment, whereas the two inhibitors had no such effect. Scale bar: 100 μm. The average number of DCFH-DA-positive cells was obtained by calculating the average value of four visual fields. (B) Protein expression of GPX4 in cells after pretreatment with DFO for 12 hours followed by erastin treatment after 48 hours. (C) Protein expression of xCT in cells after pretreatment with DFO for 12 hours followed by erastin treatment after 48 hours. Data are shown as the mean ± SEM (one-way analysis of variance followed by post-hoc Bonferroni test (for ROS levels) or Student’s t-test (for GPX4 and xCT expression)). Each experiment was performed in triplicate. *P < 0.05, ***P < 0.001. DFO: Deferoxamine; DMSO: dimethyl sulfoxide; GPX4: glutathione peroxidase 4; PBS: phosphate-buffered saline; ROS: reactive oxygen species; xCT: system Xc-light chain.
