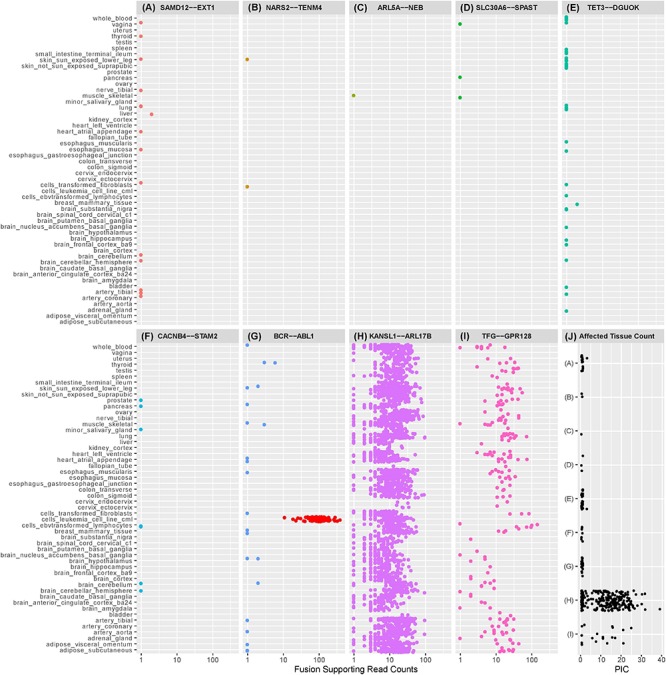
FIGURE 1.

Dot plots illustrating the number of observations of selected exon-exon fusion transcripts in the GTEx RNA-Seq data by tissue type. Fusion analysis was performed using RNA-Seq data from 8187 samples passing QC, representing 549 individuals and 52 tissue types, extracted from GTEx (version 6p). Fusion transcript identification was performed using STAR-Fusion (Haas et al., 2017) with default settings following STAR (v2.5.2b) two-pass alignment (Dobin et al., 2013). Similar to our previously described methods, preliminary fusion calls were used to maximize sensitivity by avoiding default filters encoded in the callers (Oliver et al., 2019b). Fusion-supporting junction and spanning reads identified by STAR Fusion were combined into a single supporting read count for each event. Fusions (A)–(F) are fusion candidates originating from a cohort analysis of rare disease patients previously published by the authors (Oliver et al., 2019b). Five fusions experimentally validated in the authors’ cohort analysis were not observed in the GTEx database and are not displayed in the figure. SAMD12-EXT1 (A) was detected in the authors’ cohort study and demonstrated to be a pathogenic event responsible for the rare condition of multiple exostoses. Candidate SAMD12-EXT1 fusions sharing the same exon-exon boundaries were later shown to be detectable with limited read support in a subset of tissues for five healthy individuals in GTEx. A selection of alternative exon-exon SAMD12-EXT1 fusions were observed in 10 further healthy individuals. The oncogenic BCR-ABL1 (G) was detectable in 22 healthy individuals, although with limited read support and within a small subset of tissues. Limited read support observed in healthy individuals contrasts strongly with the substantial read support visible in leukemia cell lines (red dots). KANSL1-ARL17B (H) and TFG-GPR128 (I) are previously described polymorphic fusion events, observed here in larger numbers of patients and tissues, with greater read support than the pathogenic or suspected pathogenic fusions originating from the authors’ cohort study. (J) shows the per-individual affected tissue count (PIC) for each healthy individual for which a fusion candidate was detectable. Each dot represents the number of tissues containing the relevant fusion in a single individual. Fusions in (J) are labeled (A–I) corresponding to the fusions appearing in plots (A–I). Pathogenic or potentially pathogenic fusions from the authors’ cohort study are detectable in small numbers of tissues per individual, similarly to the known pathogenic BCR-ABL1 fusion event. Polymorphic fusions are detectable in larger numbers of tissues per healthy individual.
