Figure 3.

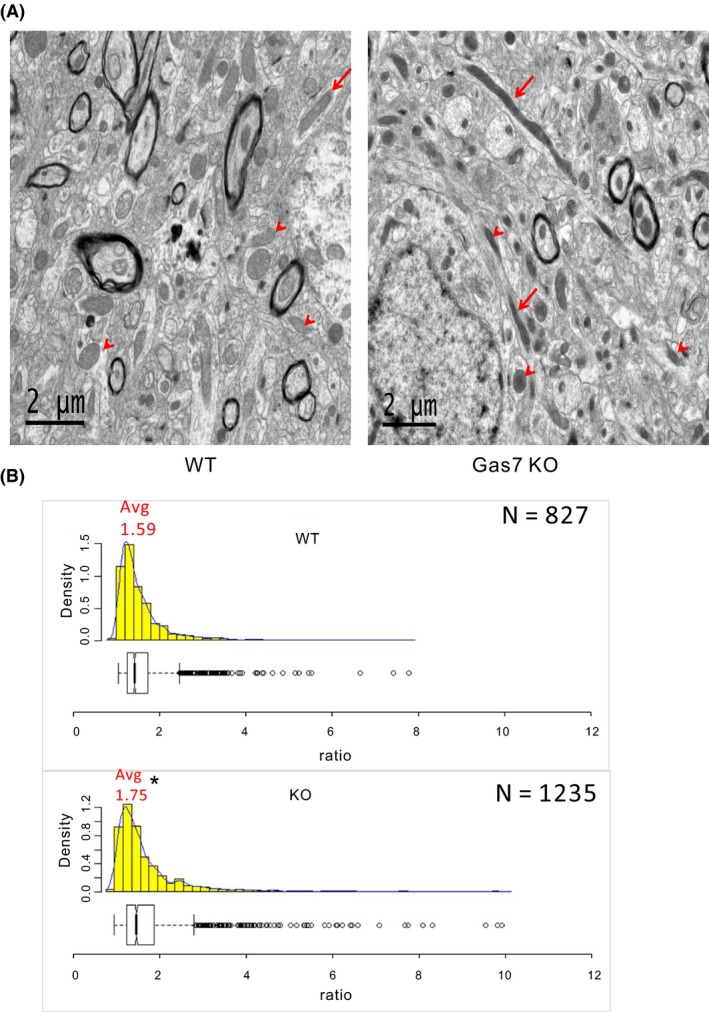
Mitochondrial length increases in gas7‐knockout mouse brain cortex compared with wild‐type mice. A, Wild‐type (left panel) and gas7‐knockout (right panel) mouse cortex showing mitochondria with different aspect ratios (length‐to‐width ratio). As defined by the box plot in B, outliers are marked with red arrows and nonoutliers are marked with red arrowheads. B, Histogram and box plot of mitochondria aspect ratios from wild‐type (left) (N = 823) and gas7‐knockout (right) cortical sections (N = 1235). *P < .001. Avg, average. The minimum value of the aspect ratio (length‐to‐width ratio) of a mitochondrion is 1 when its length equals its width. Bin widths of histograms are equivalent to aspect ratio increments of 0.2. Count represents the number of mitochondria per bin width
