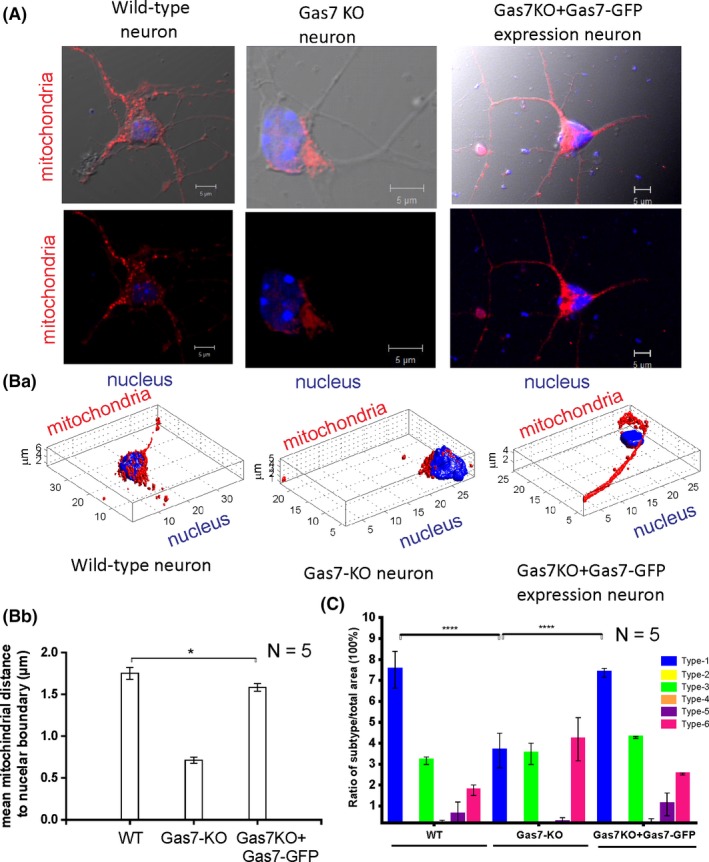
Figure 4.

Mitochondrial morphology and heterogeneity is affected in gas7‐knockout neurons compared with wild‐type neurons and can be rescued by ectopic expression of Gas7. A, Immunofluorescence analysis of nuclei and mitochondrial staining (labeled red using SDHA antibodies) in wild‐type neurons, gas7‐knockout neurons, and gas7 KO + Gas7‐GFP neurons. Top panel shows wild‐type neurons, gas7‐knockout neurons, or gas7‐knockout neurons rescued with Gas7 ectopic expression, with mitochondria in red and nucleus in blue shows with merged images of these neurons with DIC images of the respective neurons to show neuronal morphology. Bottom panel shows merged images mitochondria and nucleus of these neurons without DIC images of the respective neurons. Ba, Changes in mitochondrial distribution in wild‐type neurons, gas7‐knockout neurons, or gas7 KO + Gas7‐GFP neurons (ie, rescued by Gas7 ectopic expression) using Micro‐P 3D analysis. Immunofluorescence staining of nuclei (blue) and mitochondria (red) indicates the dispersed distribution of mitochondria in wild‐type or the perinuclear clustering of mitochondria in gas7‐knockout neurons. Ectopic expression of Gas7 can restore the dispersed distribution of mitochondria in gas7‐knockout neurons. Bb, A presentation of mean distance from mitochondria to the nuclear boundary (µm) calculated using Micro‐P 3D software. Bar graphs for wild‐type, gas7‐knockout, and gas7 KO + Gas7‐GFP neurons are expressed as means ± SD n = 5, columns = means; error bars = SEs. C, Micro‐P classified mitochondria into six types: small fragmented (type 1, blue), large fragmented (type 2, yellow), straight tubular (type 3, green), curved tubular (type 4, orange), horseshoe/donut/network tubular (type 5, purple), or branching tubular (type 6, pink). Bar graph showing the percentages of each type of mitochondria, expressed as means ± SD. n = 5, *P < .001
