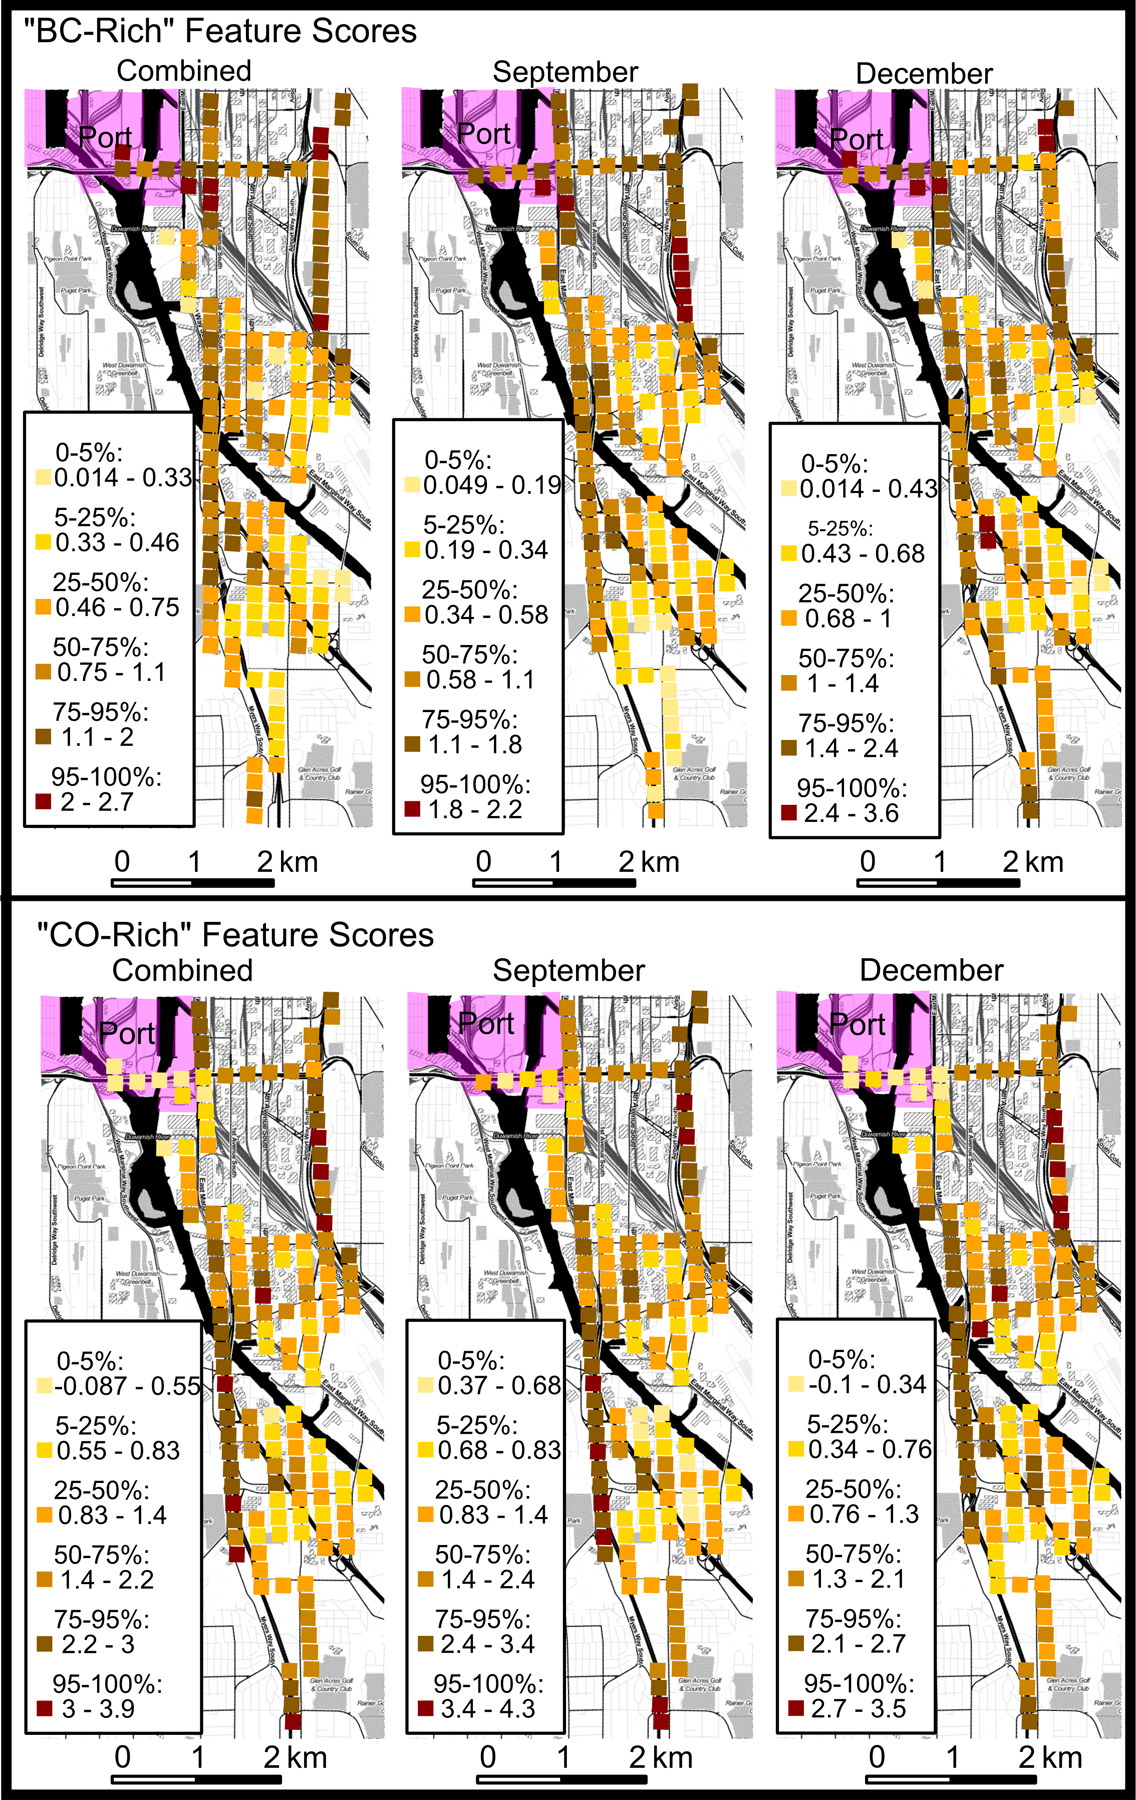
Figure 2.

Map of varimax-rotated absolute principal component scores (see also equation 4 in section 3.2). The color scale represents quantiles of the resultant cell medians. The black area is water. The pink area in the upper left-hand corner is the southern tip of Harbor Island, part of the Port of Seattle.
