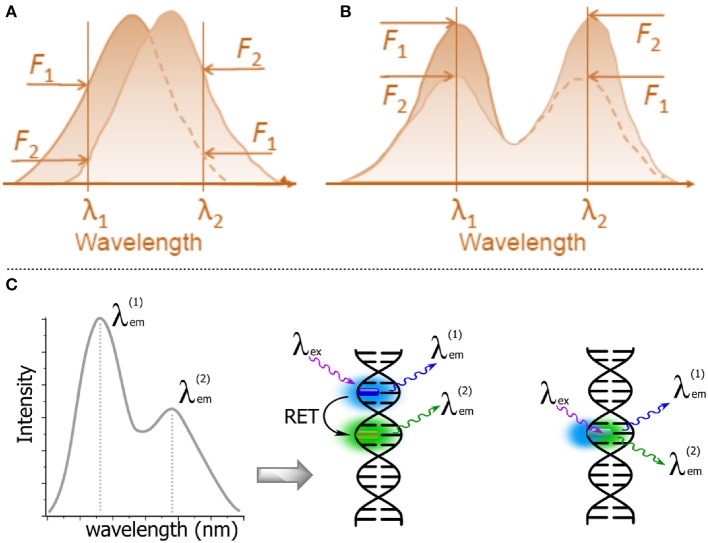
Figure 11.
Schematic representations of λ-ratiometric sensing recorded at two fixed wavelengths for a single fluorescent probe. (A) The spectral shift defines the sensing response (e.g., Nile Red). (B) The decrease of intensity of one band λ1 and the concomitant increase of intensity at a different band λ2 define the sensing response. Calculating the change in the intensity ratio F(λ1)/F(λ2) enables quantitative measurements (Demchenko, 2013). (C) Dual emission: two-dyes (e.g., exhibiting resonance energy transfer, RET) vs. a one-dye approach based on the generation of a new band for the recording of a ratiometric signal.

