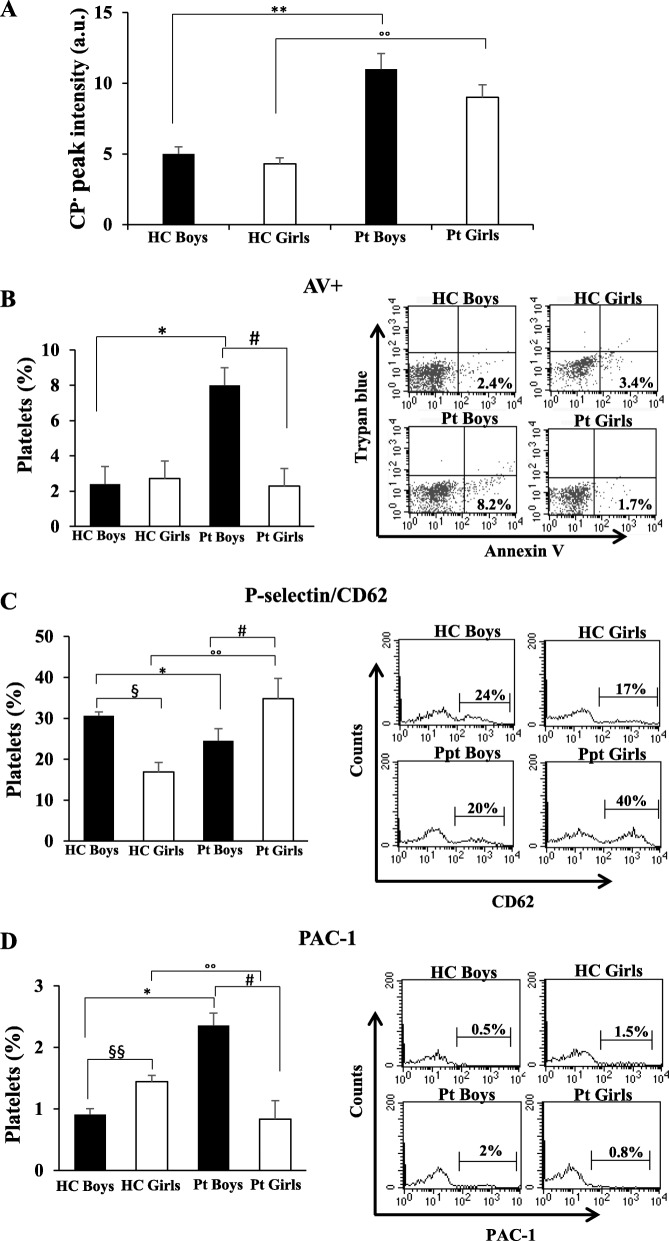
Fig. 1.
ROS production evaluation and platelet characteristics in patients with bronchiolitis (15 boys and 12 girls). a ROS levels measured in fresh whole blood by electron paramagnetic resonance. ##/°°p < 0.01 (Patients vs HCs). The measures were carried out in triplicate. Histograms showing the percentage of platelets positives to: b Annexin V; c P-selectin/CD62; d PAC-1. Measures carried out by flow cytometry. The values represent the percentage ± SD of positive cells. Statistical analysis was performed by one-way analysis of variance (ANOVA). # p < 0.05 (Boys patients vs Boys HC); ## p < 0.01(Boys patients vs Boys HC); °°p < 0.01 (Girls patients vs Girls HC); °°°p < 0.001 (Girls patients vs Girls HC); §p < 0.05 (Boys patients vs Girls patients); §§p < 0.01 (Boys patients vs Girls patients). On the right typical flow cytometric measures of a representative HC boy and a representative patient boy, and a representative HC girl and a representative patient girl. (Pt = patient; HC = control group)

