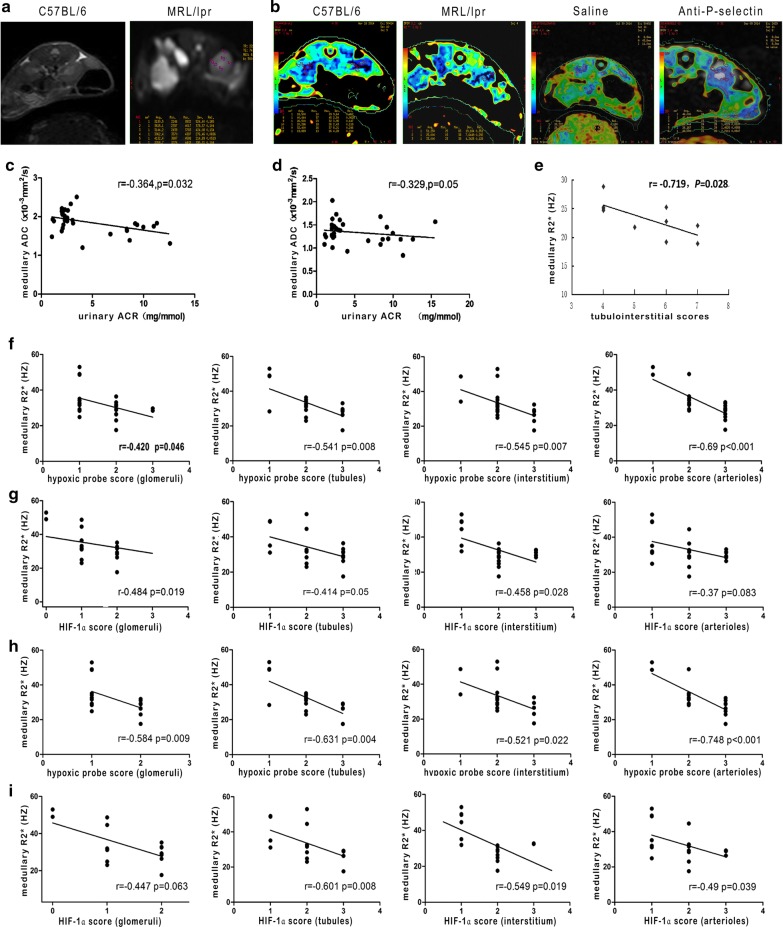
Fig. 5.
Evaluation of renal hypoxia in MRL/lpr mice through BOLD-MRI. a Representative T2* images of C57BL/6 and MRL/lpr mice. b Representative R2* images in the C57BL/6, MRL/lpr, saline, and anti-P-selectin groups. c Correlation between medullary ADC and urinary ACR in the C56BL/6 and MRL/lpr groups when b = 500 s/mm2. d Correlation between medullary ADC and urinary ACR in the C56BL/6 and MRL/lpr groups when b = 800 s/mm2. e Correlation between medullary R2* and tubulointerstitial scores in the C56BL/6 and MRL/lpr groups. f Correlation between medullary R2* and hypoxic probe score of glomeruli, tubules, interstitium, and arterioles, respectively, in the C56BL/6 and MRL/lpr groups. g Correlation between medullary R2* and HIF-1α score of glomeruli, tubules, interstitium, and arterioles, respectively, in the C56BL/6 and MRL/lpr groups. h Correlation between medullary R2* and hypoxic probe score of glomeruli, tubules, interstitium, and arterioles, respectively, in the saline and anti-P-selectin groups. g Correlation between the medullary R2* and HIF-1α score of glomeruli, tubules, interstitium, and arterioles, respectively, in the saline and anti-P-selectin groups

