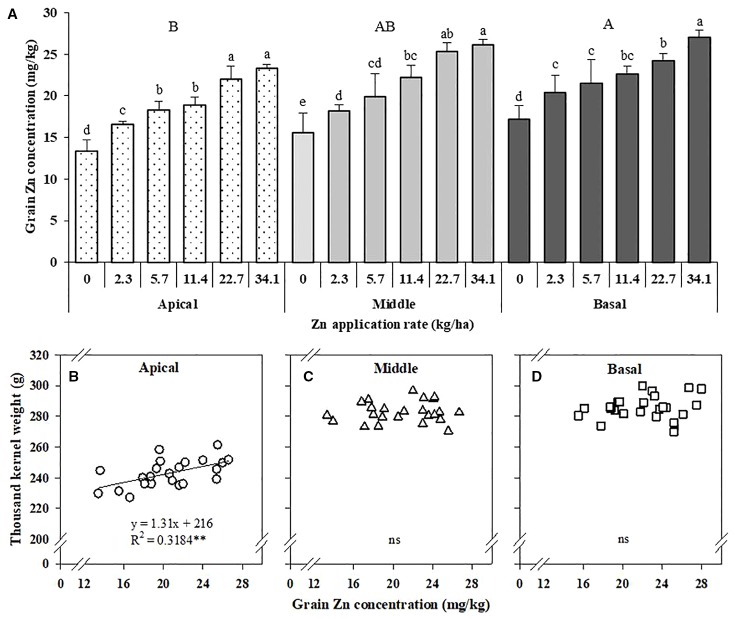
Figure 5.
Effects of Zn application on Zn concentration in different sections of maize spikes (A) and correlation of the 1,000-kernel weight of the apical (B), middle (C), and basal (D) sections of maize spikes with Zn concentration. Values are the average ± SE of four replicates. Within each section means with the same lowercase letters are not significantly different at P < 0.05 according to Fisher’s LSD test. The different capital letters indicate a significant difference between sections. ** P < 0.01. ns, not significant.

