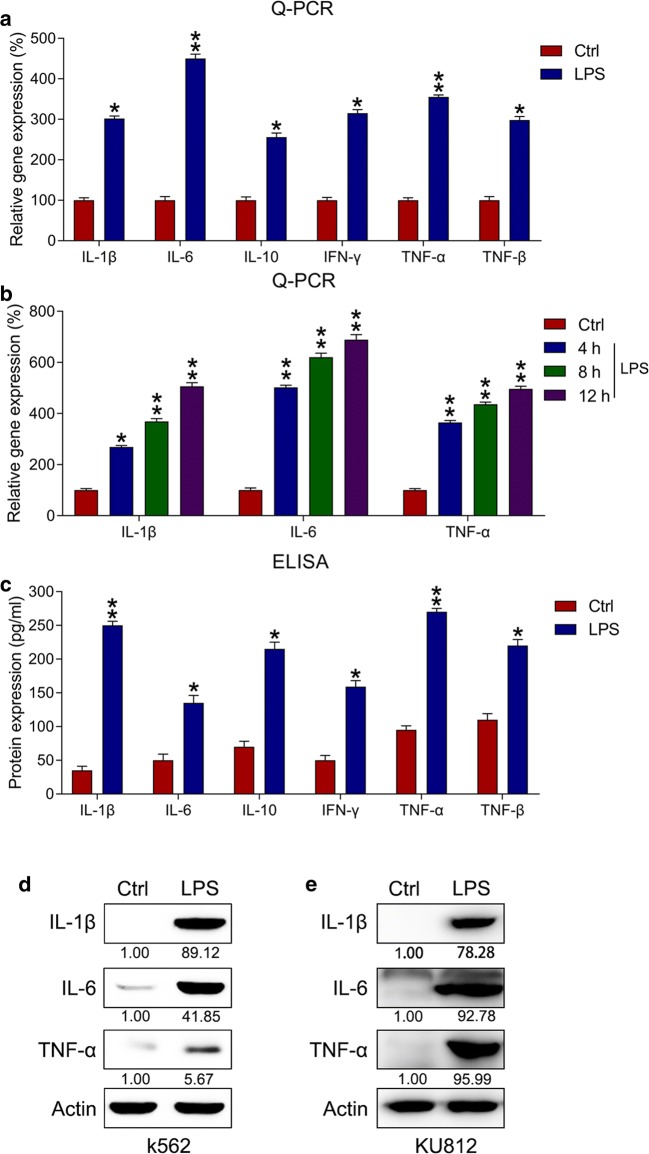
Fig. 1.
LPS-triggered production of proinflammatory cytokines in k562 cells. Cytokines and chemokines in LPS-treated k562 cells were detected using qPCR, ELISA, and WB. a Influence of LPS treatment on mRNA expressions of inflammatory cytokines in k562 cells determined via qPCR. b qPCR was performed to examine the mRNA expression of inflammatory cytokines after LPS treatment in k562 cells. In qPCR, gene expressionin each group was first normalized to the GAPDH gene, and then normalized to the data of the control group. c Influence of LPS treatment on the protein expressions of inflammatory cytokines in k562 cells determined via ELISA. d, e Influence of LPS treatment on protein levels of IL-1β, IL-6, and TNF-α in both k562 and KU812 cells determined via WB analyses. Data are expressed as mean ± standard deviation. *P < 0.05, **P < 0.01 relative to the control

