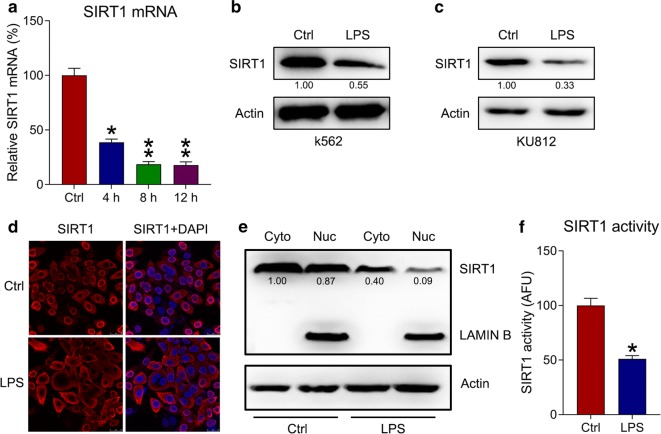
Fig. 2.
SIRT1 expression in LPS-treated k562 cells. a qPCR was used to measure the mRNA expression of SIRT1 at 0, 4, 8, and 12 h after LPS treatment in k562 cells. b, c WB was performed to detect SIRT1 protein levels in k562 and KU812 cells after LPS treatment. d SIRT1 subcellular localization in LPS-treated k562 cells detected using IFA. SIRT1 was stained to red using anti-SIRT1 antibody (red), whereas nuclear DNA was counterstained blue using DAPI (blue). The merged image displays the nuclear localization of SIRT1. e Cell fractionation assay showed the location of SIRT1 in nuclear and cytoplasmic fractions. f SIRT1 activity was detected in the whole cell lysate. Data are expressed as mean ± standard deviation. *P < 0.05, **P < 0.01 relative to the control

