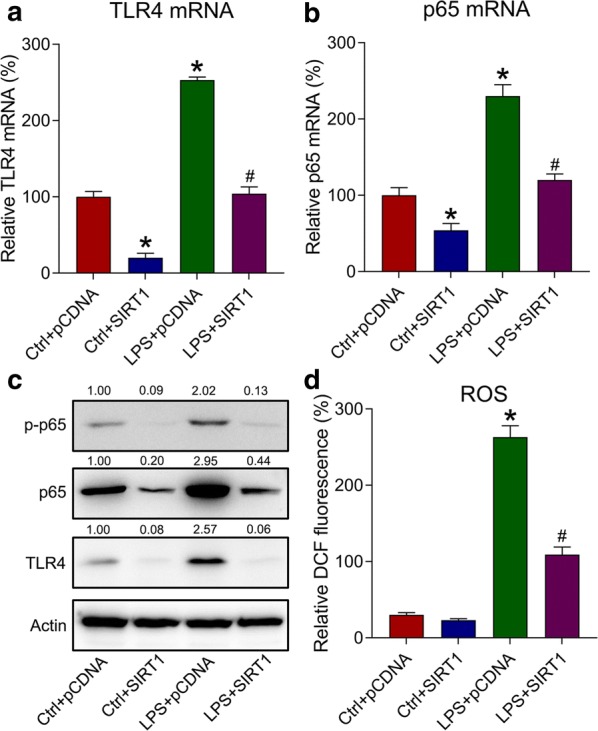
Fig. 4.

Role of SIRT1 overexpression in activating the TLR4–NFκB–ROS axis in LPS-treated k562 cells. Here, k562 cells were transfected with SIRT6-expressing plasmid/empty plasmid, followed by exposure to 10 μg/mL of LPS or not for 4 h. a, b The mRNA expressions of TLR4 and p65 were detected by qPCR. Gene expression in each group was first normalized to the GAPDH gene, and then normalized to the data of the LPS-pCDNA group. c The influence of SIRT1 overexpression on TLR4, p65, and p65 phosphorylation was assessed using WB. d ROS production reflected by DCF fluorescence intensity was determined in LPS-treated cells. Data are expressed as mean ± standard deviation. *P < 0.05 relative to the control + pCDNA group; #P < 0.05 relative to the LPS + pCDNA group
