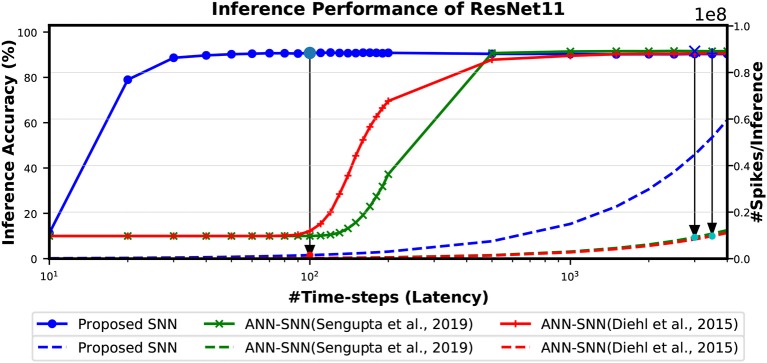
Figure 9.
The comparison of “accuracy vs. latency vs. #spikes/inference” for ResNet11 architecture. In this figure, the solid lines are representing inference accuracy while the dashed lines are representing #spikes/inference. The slope of #spikes/inference curve of the proposed SNN is larger than ANN-SNN converted networks. However, since proposed SNN requires much less time-steps for inference, the number of spikes required for one image inference is significantly lower compared to ANN-SNN. The required #time-steps and corresponding #spikes/inference are shown using highlighted points connected by arrows. Log scale is used for x-axis for easier viewing of the accuracy changes for lower number of time-steps.

