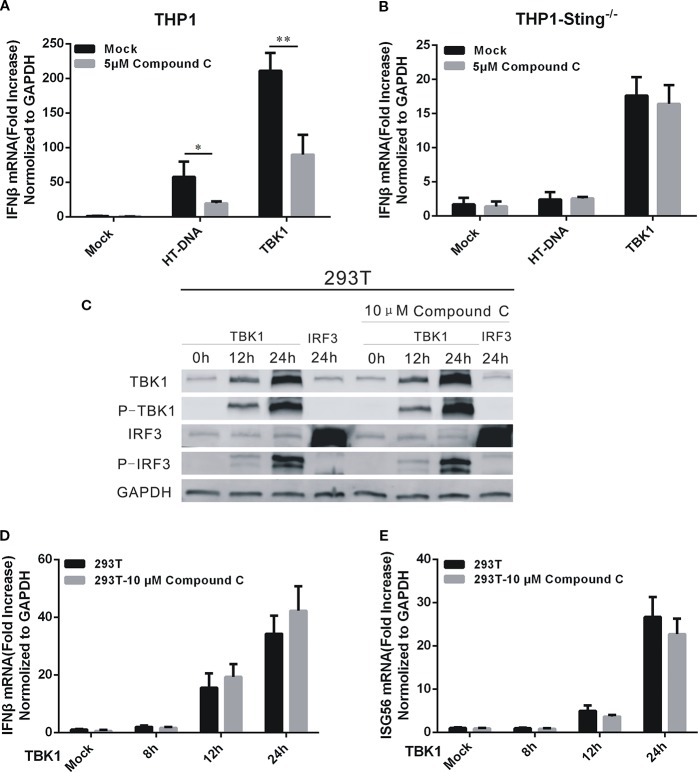
Figure 4.
The target of Compound C was in the upstream of TBK1. (A, B) RT-qPCR analyses of IFNβ expression levels in THP1 wild-type (A) and THP1-STING-/- (B) cells. The cells were transfected with HT-DNA and pcDNA 3.1-TBK1-Flag after treated with indicated dose of Compound C. (C) Western blot analyses of TBK1, p-TBK1, IRF3, and p-IRF3 expression in 293T cells. The 293T cells were treated with 10 μM Compound C followed by transfection with pcDNA3.1-TBK1-Flag and pcDNA3.1-IRF3-Flag. (D, E) RT-qPCR analyses of IFNβ (D) and ISG56 (E) expression in 293T cells. The 293T cells were treated with 10 μM Compound C followed by transfection with pcDNA3.1-TBK1-Flag for 12 h and 24 h, respectively. The experiments were performed at least three times. The statistical analyses were performed by Student’s-t test and the data are presented as mean ± SD (n = 3) with asterisks indicating significant changes (* P < 0.05, **P < 0.01).

