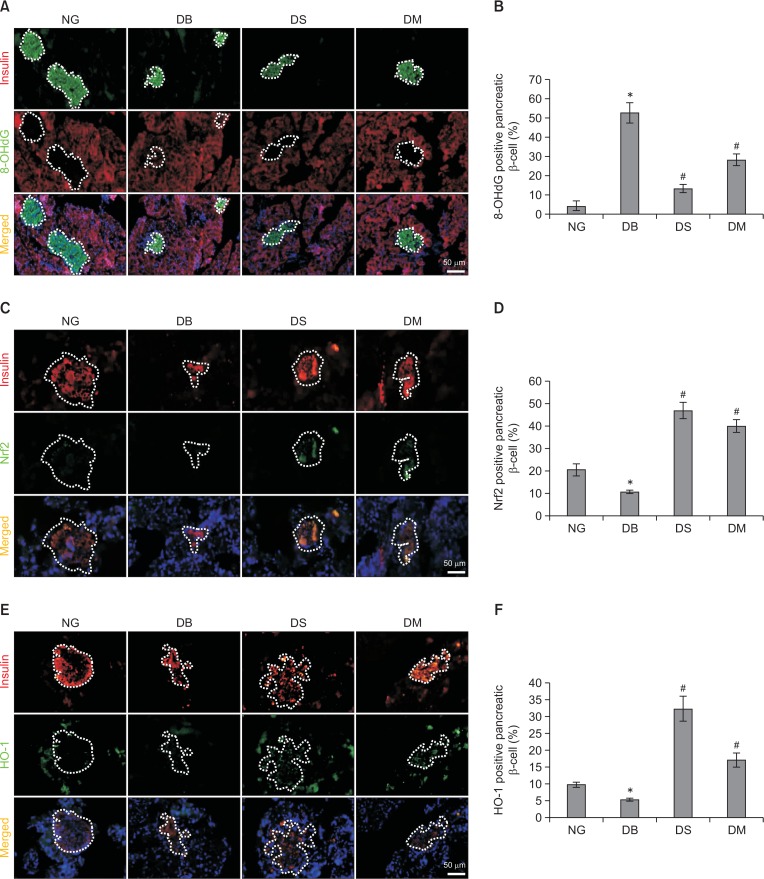
Fig. 2.
Silibinin treatment up-regulates the expression of Nrf2 and HO-1 in pancreatic β-cells of diabetic rats. (A, B) Representative images of immunofluorescence labeling of insulin and 8-OHdG, and quantitative results of 8-OHdG-positive pancreatic β-cell percentage in islets. (C, D) Representative images of insulin/Nrf2 double immunofluorescence staining and quantitative analysis of Nrf2-positive pancreatic β-cell percentage in islets. (E, F) Representative images and the quantitative results of insulin/HO-1 double immunofluorescence staining. Magnification, ×200; scale bar, 50 μm. NG, normoglycemia; DB, diabetes; DS, diabetes+silibinin; DM, diabetes+metformin. Data are mean ± SEM (n=6 in each group). *p<0.05 vs. NG group; #p<0.05 vs. DB group.

