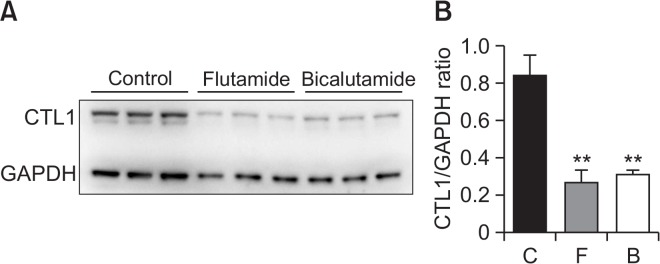
Fig. 6.
Effect of flutamide and bicalutamide on CTL1 protein levels in LNCaP cells. Cells were incubated with 100 μM flutamide (F) and bicalutamide (B) for 24 h. Western blot analysis (A) and densitometry (B) show CTL1 levels in total cell lysates from drug-treated LNCaP cells. The bar graph represents the densitometric measurement of CTL1 protein normalized to GAPDH. The experiment was performed in triplicate. The densitometric data are presented as the means ± SD. **p<0.01 compared with control (C).

